How to Monitor Network Traffic on Linux Using vnStat
Developers and sysadmins may need to monitor various network parameters, such as bandwidth consumption and the traffic flowing in/out. There are many tools available for this purpose, one of them being vnStat. It is a simple CLI utility that shows network statistics over various interfaces and periods for a particular computer. In this article, we will see how to install and work with vnStat, and (optionally) view this data graphically using vnstat-dashboard.
Installation
For Ubuntu and Debian systems, vnStat is available in the default repository. Use the following commands in order to install it:
sudo apt update
sudo apt install vnstat
The default repositories for CentOS and Fedora don’t have vnStat, but you can get them from the EPEL repositories. Thus, you should enable the EPEL repositories, and then install vnStat. Use the following commands to do so:
sudo yum install epel-release
sudo yum install vnstat
For Fedora systems, type in the following:
sudo dnf update
sudo dnf install vnstat
Setting up vnStat
After installing vnStat, you have to set the network interface which you want to monitor. However, first you need to know the list of network interfaces available on our system before you can ask vnStat to monitor it. To do so, use any of the two commands:
ip link showor
netstat -iThis will show a list of all network interfaces available in the system.
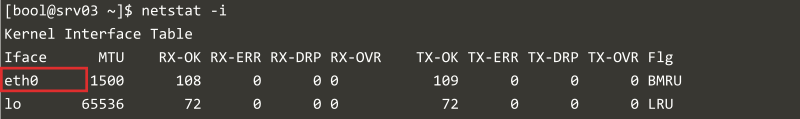
For this article, we will just monitor the interface representing Ethernet connection to our system, which is eth0 in our example. On your system, you may find the interface named differently, such as enp0s3 or venet0. If you use WiFi, there will be a interface such as wlan0 or wifi0. Any interfaces with names like lo or lo0 represent the loopback interface, which is used for local traffic, such as communication between daemons.
So, to select the eth0 interface for monitoring, use the command:
sudo vnstat -u -i eth0It should tell you that a database has been created. Then, you should set proper permissions for the database with:
sudo chown -R vnstat: /var/lib/vnstatFinally, enable and restart the daemon with:
sudo systemctl enable vnstat
sudo systemctl restart vnstat
You can verify that the daemon is running with top, or with systemctl status:
sudo systemctl status vnstat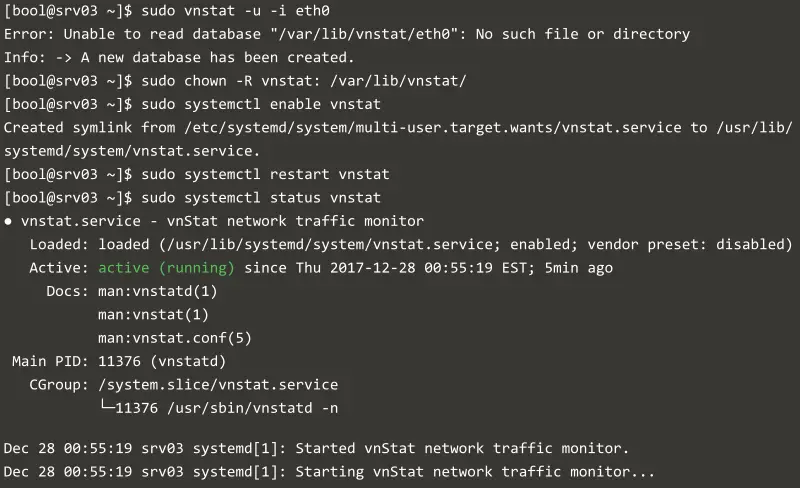
Viewing bandwidth consumption
By default, vnStat writes fresh statistics to the database every 30 seconds. After waiting for 30 seconds, run vnstat to view the monthly and daily statistics in a tabular form. If your system doesn’t receive too much traffic, you can try downloading these files to generate some traffic before viewing the statistics.
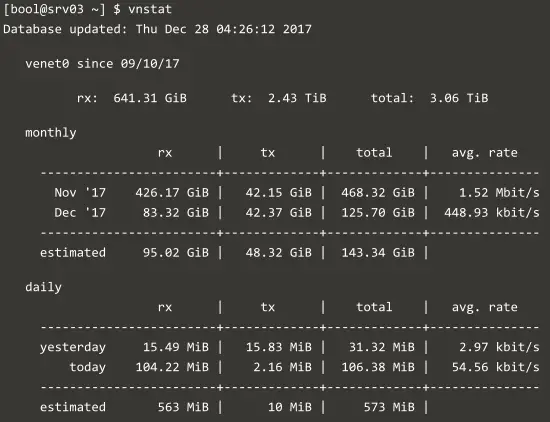
The “rx” and “tx” columns show the received and transmitted traffic respectively, and the “total” column gives the sum of these two values. The “avg. rate” shows the average rate of bandwidth consumption per second, over the course of the day or month.
Sometimes, you may want to see the updated bandwidth usage immediately without waiting. In that case, you can force vnStat to update the database with:
sudo vnstat -uThen, run vnstat as usual; you will get to see the updated statistics after you do so.
If you want to view statistics for a different timeframe, there are different switches you can use:
-d: Daily statistics for the last 30 days.-m: Monthly statistics for the past 12 months.-w: Statistics for the last 7 days, and the current and previous week.-h: Hourly statistics for the last 24 hours.-t: Top 10 days with the highest traffic.
You can use these switches like so:
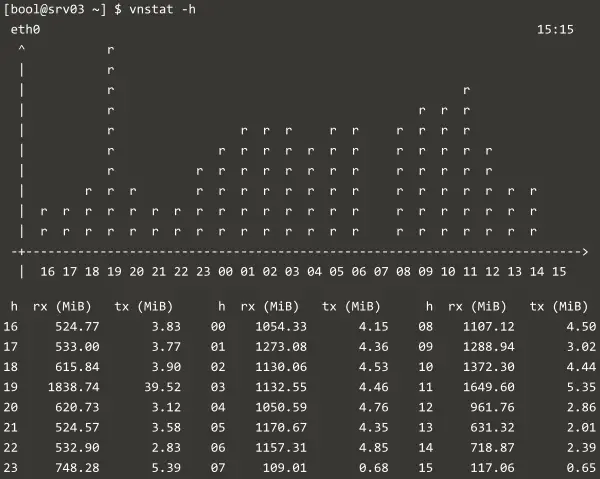
vnstat -hThe hourly statistics also feature a graph, along with the “rx”/“tx” values, as shown below. The other switches show a tabular output, like the one in the previous example.
In addition, vnStat also features a live traffic monitoring mode. To use this mode, use the -l switch and give the name of the interface with -i like so:
vnstat -l -i eth0Once you’re done, press Ctrl+C to exit.
Exporting and importing data
So far, we have seen how to retrieve bandwidth usage data from vnStat. However, the tables are not very useful if you want to perform your own calculations. You can export the data in JSON and XML by using the --json and --xml switches respectively. For example, if you want to create a file named output.json with all bandwidth usage data, run:
vnstat --json > output.jsonIf you want to import the database on to another system, you should first export the database with the --exportdb switch. The following command writes the database to a plain-text file named vnstat_db.
vnstat --exportdb > vnstat_dbNow, you can transfer this file on the other system, and use the --importdb switch to import. For example, if you want to import the vnstat_db file for the eth0 interface, run:
sudo vnstat --importdb vnstat_db -i eth0 --forceView vnStat data over the web
If you want to monitor network statistics over the web, there are various tools that work alongside vnStat. In this article, we will look at vnstat-dashboard, a web application that helps you visualize vnStat data. In order to use it, you need to install a web server, PHP and a few other tools. We will use Apache simply as an example; but you are free to use another web server.
On an Ubuntu/Debian system, run these commands to install the necessary tools:
sudo apt install apache2 php wget unzipIf you are on a CentOS/RHEL system, run these commands instead:
sudo yum install httpd php wget unzip(For a Fedora system, simply replace yum with dnf.)
Then, download the source code from Github, and unzip in the proper directory:
wget https://github.com/alexandermarston/vnstat-dashboard/archive/master.zip
unzip master.zip
sudo mv vnstat-dashboard-master/ /var/www/html/vnstat/
Next, we need to change a few configuration parameters. To do so, open the configuration file in a text editor like vi or nano:
sudo nano /var/www/html/vnstat/config.phpFind the following lines in this file and replace the default values with the ones shown in red:
$vnstat_bin_dir = '/usr/bin/vnstat';
$use_predefined_interfaces = true;
if ($use_predefined_interfaces == true) {
  $interface_list = array("eth0");
  // ...
}
After you’ve made these changes, open http://<your_server_IP>/vnstat in a browser. You should see a page like this open up:
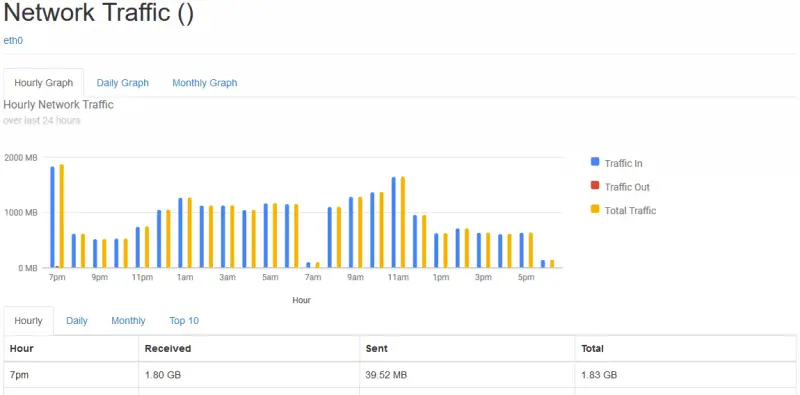
You can easily toggle between the hourly, daily and monthly tabs and also switch between various network interfaces.
Conclusion
vnStat is a very useful tool to monitor and analyze network information of a system. There are a variety of options available to view and log the data of network interfaces which can be used for several use cases.