How to Install and Use Prometheus for Monitoring

Monitoring is an important part of managing applications deployed on servers. They help you ensure applications run smoothly, as well as troubleshoot any problems that may arise. In this article, we will look at Prometheus, which is a powerful open-source monitoring tool. Originally developed at SoundCloud, it has seen significant adoption in recent times. It pulls in metrics from various sources and stores them in a time-series database. It offers a powerful query language and the ability to visualize data using third-party tools.
What is Prometheus?
The Prometheus ecosystem consists of a number of components working together, as shown below.
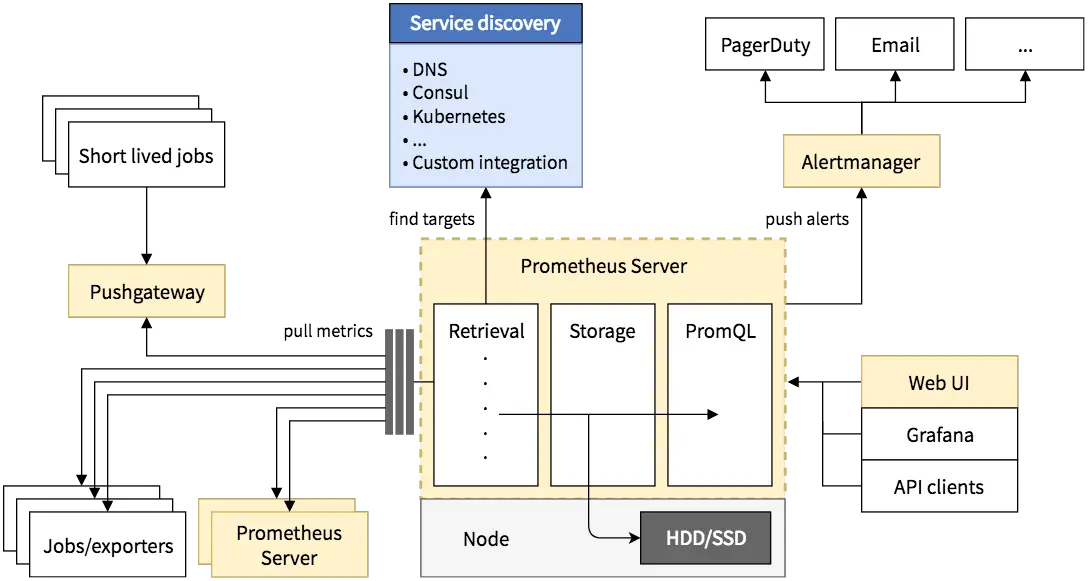
The Prometheus server pulls in metrics at regular intervals through HTTP endpoints that provide information about hosts and various applications. These endpoints may be provided by the monitored application itself, or through an “exporter”. The endpoint URL is usually /metrics, and provides data as text or protobuf.
Short-lived jobs may push their metrics to “Pushgateway” for later retrieval by the server. In addition, you can use Prometheus to monitor other instances of it, since it makes its own metrics available in the same way.
After the server has collected the metrics, it saves it in a time-series database. Then, you can use PromQL to query this data. Prometheus provides a web interface to run queries. Other applications can run queries through the HTTP API to retrieve and work with the data. For example, third-party tools like Grafana use this API to help you visualize the data.
If you want to receive alerts via Slack, Email, PagerDuty or another platform, you may set up alerts through “AlertManager”. It is quite powerful, and supports features like grouping similar kinds of alerts or temporarily muting some alerts.
Note that many of these components such as Pushgateway or Alertmanager are optional — you may or may not use them, as per your need.
Setting up Prometheus
In this section, we will download and install Prometheus on a Linux system. Then, we will set it up to monitor two types of metrics — metrics of our current system (such as load average and free memory) using node_exporter, and metrics of the Prometheus server itself. This is a highly atypical setup — usually you would monitor other Prometheus instances or other machines. However, this simple setup will help us understand the basics of Prometheus monitoring. It will also serve as a good starting point for you to set up more complex monitoring setups.
Installing node_exporter
First, we will download node_exporter.Head over to the downloads page and download the latest version, like so:
wget https://github.com/prometheus/node_exporter/releases/download/v0.15.2/node_exporter-0.15.2.linux-amd64.tar.gzThen, we will extract the downloaded archive. In our case, this results in a directory named node_exporter-0.15.2.linux-amd64.
tar -xf node_exporter-0.15.2.linux-amd64.tar.gzNext, move the node_exporter binary to /usr/local/bin:
sudo mv node_exporter-0.15.2.linux-amd64/node_exporter /usr/local/binFinally, remove the residual files with:
rm -r node_exporter-0.15.2.linux-amd64*Creating users and service files for node_exporter
For security reasons, it is always recommended to run any services/daemons in separate accounts of their own. Thus, we are going to create an user account for node_exporter. We have used the -r flag to indicate it is a system account, and set the default shell to /bin/false using -s to prevent logins.
sudo useradd -rs /bin/false node_exporterThen, we will create a systemd unit file so that node_exporter can be started at boot like a regular system service. Create a file in /etc/systemd/system/node_exporter.service with the following contents:
[Unit]
Description=Node Exporter
After=network.target

[Service]
User=node_exporter
Group=node_exporter
Type=simple
ExecStart=/usr/local/bin/node_exporter

[Install]
WantedBy=multi-user.target
Since we have created a new unit file, we must reload the systemd daemon:
sudo systemctl daemon-reloadFinally, we can set the service to always run at boot and start it:
sudo systemctl enable node_exporter
sudo systemctl start node_exporter
Installing Prometheus
The next step is to download and install Prometheus. Again, head over to the downloads page and download Prometheus like so:
wget https://github.com/prometheus/prometheus/releases/download/v2.1.0/prometheus-2.1.0.linux-amd64.tar.gzJust like how we installed node_exporter, we will extract the Prometheus archive and move the binaries to /usr/local/bin:
tar -xf prometheus-2.1.0.linux-amd64.tar.gz
sudo mv prometheus-2.1.0.linux-amd64/prometheus prometheus-2.1.0.linux-amd64/promtool /usr/local/bin
Now, we need to create directories for configuration files and other prometheus data. We will use /etc/prometheus and /var/lib/prometheus respectively.
sudo mkdir /etc/prometheus /var/lib/prometheusThen, we can move the configuration files to the directory we made previously:
sudo mv prometheus-2.1.0.linux-amd64/console prometheus-2.1.0.linux-amd64/console_libraries /etc/prometheusFinally, we can delete the leftover files as we do not need them any more:
rm -r prometheus-2.1.0-linux-amd64*Configuring Prometheus
After having installed Prometheus, we have to configure Prometheus to let it know about the HTTP endpoints it should monitor. Prometheus uses the YAML format for its configuration, which forbids tabs and requires you to use spaces for indentation.
If you want to specify default scraping settings, you can do so in the global section. On the other hand, if you want to specify which jobs/exporters should be monitored and any settings specific to them, you should do it through the scrape_configs section.
We will use /etc/prometheus/prometheus.yml as our configuration file. Create this file with a text editor and enter the following contents:
global:
  scrape_interval: 10s

scrape_configs:
  - job_name: 'prometheus_metrics'
    scrape_interval: 5s
    static_configs:
      - targets: ['localhost:9090']
  - job_name: 'node_exporter_metrics'
    scrape_interval: 5s
    static_configs:
      - targets: ['localhost:9100']
In this file, we have defined a default scraping interval (with scrape_interval) of 10 seconds. We have also define two sources of metrics, named prometheus_metrics and node_exporter_metrics. For both of them, we have set the scraping interval to 5 seconds, overriding the default. Then, we have specified the locations where these metrics will be available. Since our targets are present on the same system, we use localhost as the hostname. Prometheus uses port 9090 and node_exporter uses port 9100 to provide their metrics.
Finally, we will also change the ownership of files that Prometheus will use:
sudo chown -R prometheus: /etc/prometheus /var/lib/prometheusCreating users and service files for Prometheus
We will create an user for Prometheus, just like we had done for node_exporter:
sudo useradd -rs /bin/false prometheusThen, we will create a systemd unit file in /etc/systemd/system/prometheus.service with the following contents:
[Unit]
Description=Prometheus
After=network.target

[Service]
User=prometheus
Group=prometheus
Type=simple
ExecStart=/usr/local/bin/prometheus \
    --config.file /etc/prometheus/prometheus.yml \
    --storage.tsdb.path /var/lib/prometheus/ \
    --web.console.templates=/etc/prometheus/consoles \
    --web.console.libraries=/etc/prometheus/console_libraries

[Install]
WantedBy=multi-user.target
This file is similar to the one we previously created for node_exporter. The ExecStart directive in the file specifies a set of switches that define the paths that Prometheus should use for the configuration, storing the time-series database, and for rendering the web interface.
Next, we will reload systemd:
sudo systemctl daemon-reloadFinally, we will enable and start the service:
sudo systemctl enable prometheus
sudo systemctl start prometheus
Exploring Prometheus
Now that we have finished installing and Prometheus, it is time to explore some of its functionality. Prometheus provides a web UI for running basic queries located at http://<your_server_IP>:9090/. This is how it looks like in a web browser:
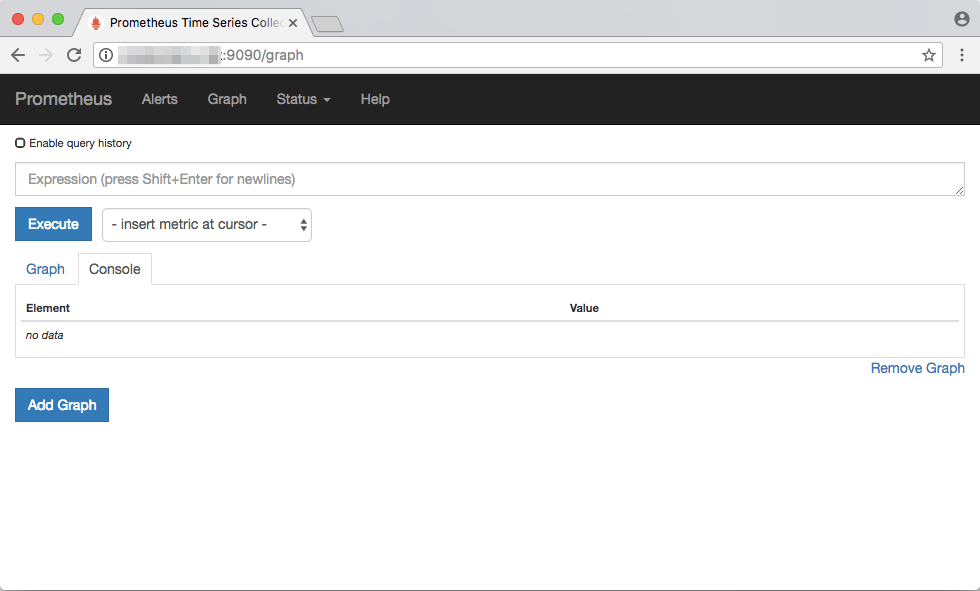
The “Console” tab is used to view the results of a query, while the “Graph” tab is used to create graphs based on a query. Later in this article, we will discuss how to write, run and graph queries.
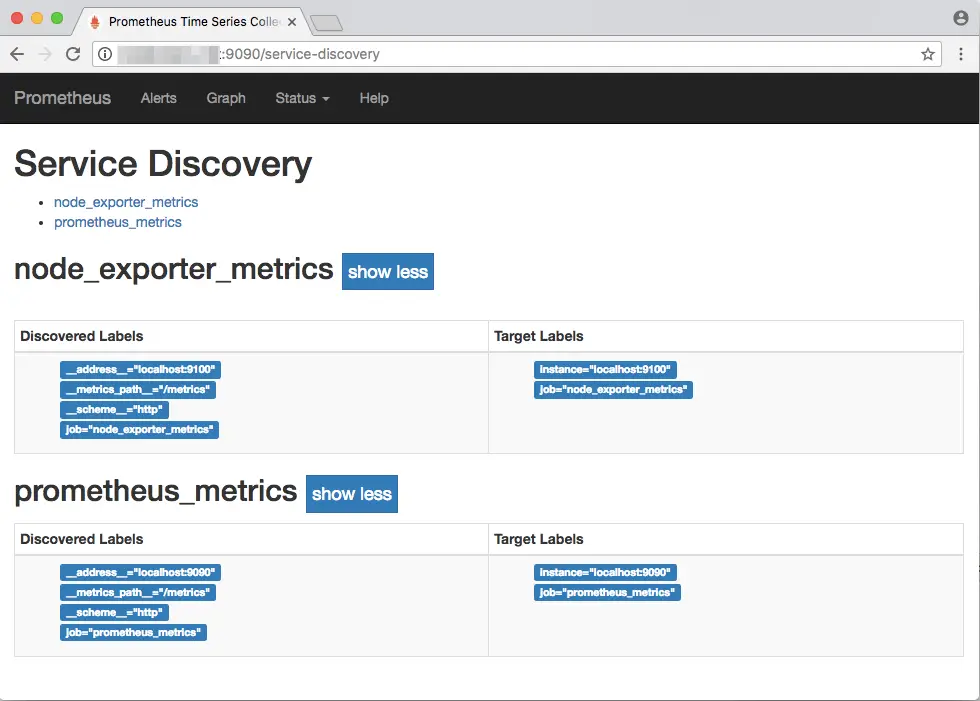
If you want to see a list of metrics sources, go to the Status → Service Discovery page. Here, you will find a list of all services that are being monitored, including the path at which the metrics are available. In this case, the default path /metrics is used.
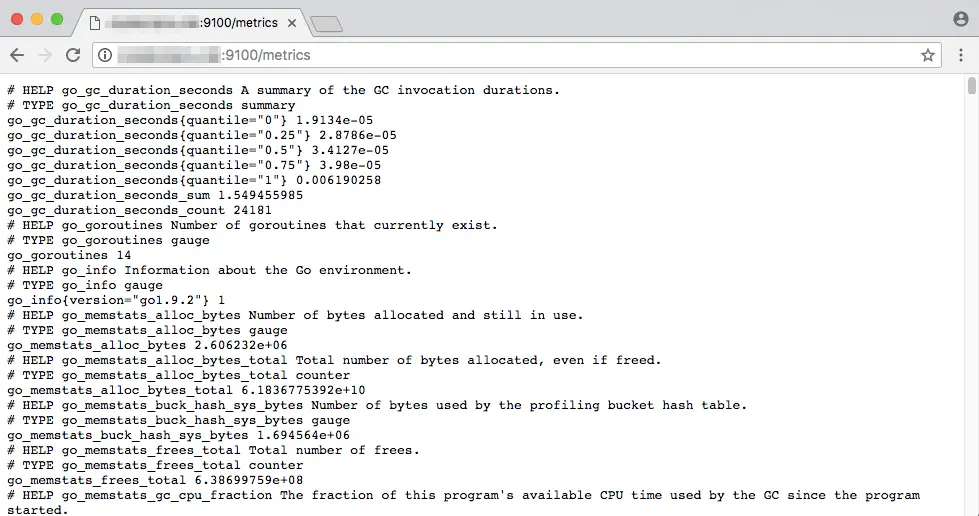
If you’re curious to see how the metrics page looks like, head over to one of them. The screenshot below shows the metrics page for node_exporter, which you can find at http://<your_server_IP>:9100/metrics.
You can return to the query interface by visiting the “Graph” link on the top of the interface.
Prometheus metrics and queries
As we previously discussed, the Prometheus server collects metrics and stores them in a time series database. Individual metrics are identified with names such as node_filesystem_avail. A metric may have a number of “labels” attached to it, to distinguish it from other similar sources of metrics. As an example, suppose node_filesystem_avail refers to the free memory available on the disks attached to a node. It may have a label such as mountpoint, which helps you inspect individual storage devices by mentioning the mountpoint. Thus, to get the available space on the device mounted as /mnt/sda1, you have to use node_filesystem_avail{mountpoint="/mnt/sda1"}.
In PromQL, an expression or subexpression should always evaluate to one of the following data types:
- Instant vector — It represents a time-varying value at a specific point of time.
- Range vector — it represents a time-varying value, over a period of time.
- Scalar — A simple numeric floating point value.
- String — A string value. String literals can be enclosed between single quotes, double quotes or backticks (
`). However, escape sequences like\nare only processed when double quotes are used.
Note that depending on the use case, only some of these data types are legal as a return value. For example, while constructing graphs (through the “Graph” tab in the web interface), only expressions that result in instant vectors can be used.
Now that we have the basic theory in place, let us see how we can query Prometheus to get information about monitored hosts and applications.
Prometheus query examples
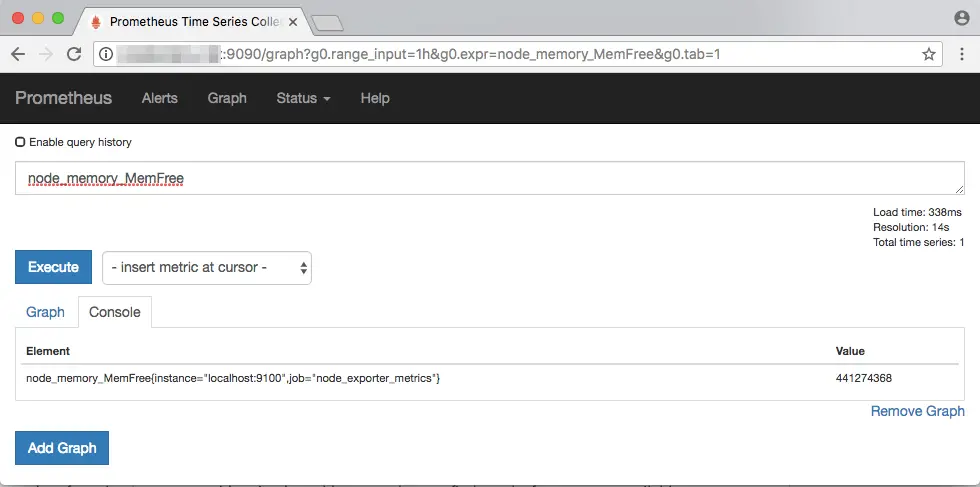
In this section, we will look at a few examples of queries. Let us start with a simple problem — we have to find out the free memory available on a system. In our setup, node_exporter provides information about the system it is monitoring. This metric is available as node_memory_MemFree. Type this in the “Expression” field and hit Enter.
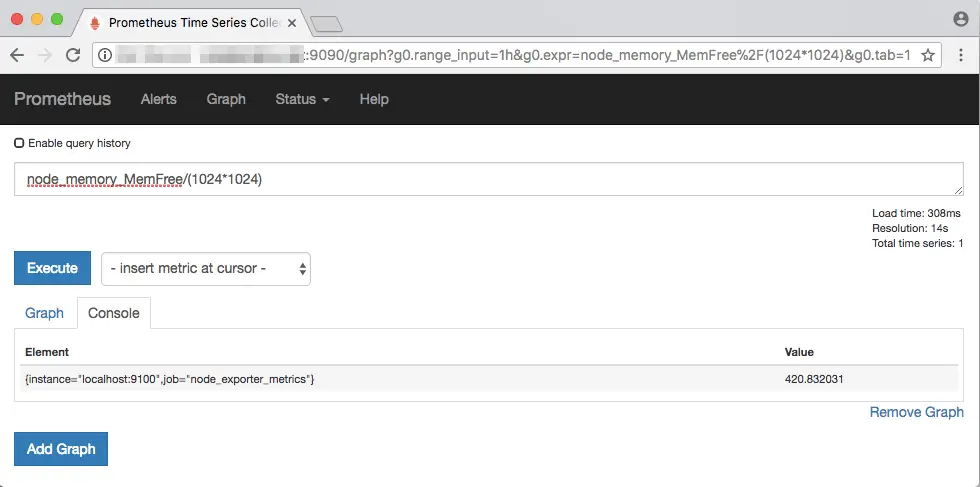
Note that the results are in bytes. In order to get a value in MBs, you can convert the value with: node_memory_MemFree/(1024*1024):
In addition, notice that the result has a set of labels like instance and job, which you can use to filter out certain instances or jobs. Since we are monitoring a single node, filtering is not very useful in in this case. For a better example, we will find out the free disk space on our system with node_filesystem_avail:
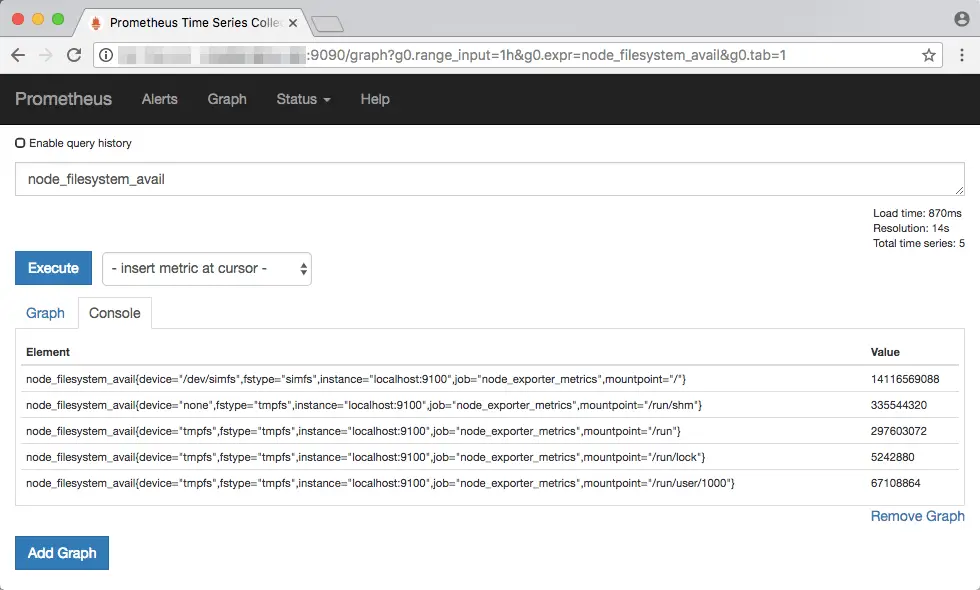
Notice how each storage device gets a label based on its mountpoint. Now, if you wanted to view the free space for the device at mountpoint /, you can type in node_filesystem_avail{mountpoint="/"}:
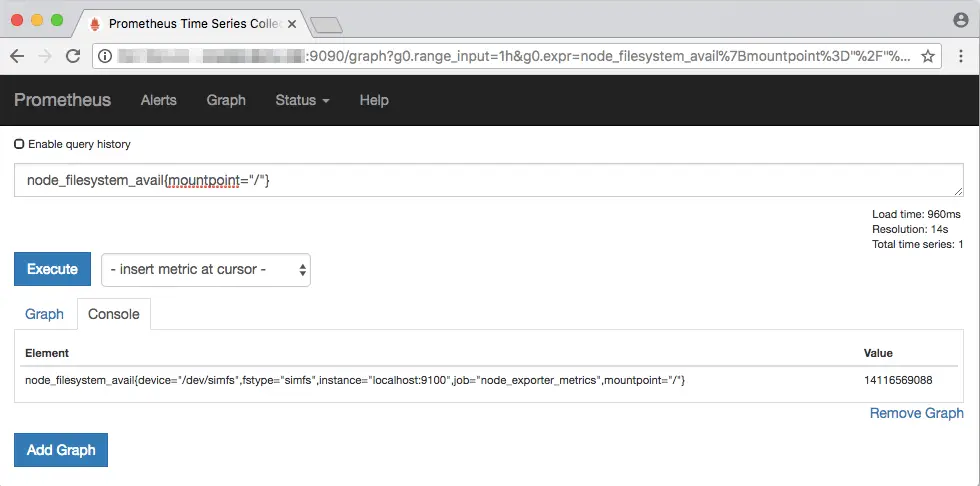 Apart from the
 = operator, the != (not equal to), =~ (regex match) and !~ (negated regex match) are also supported. Also, you can provide two or more labels in a query like: node_filesystem_avail{job=~".*metrics",mountpoint!="/"}.
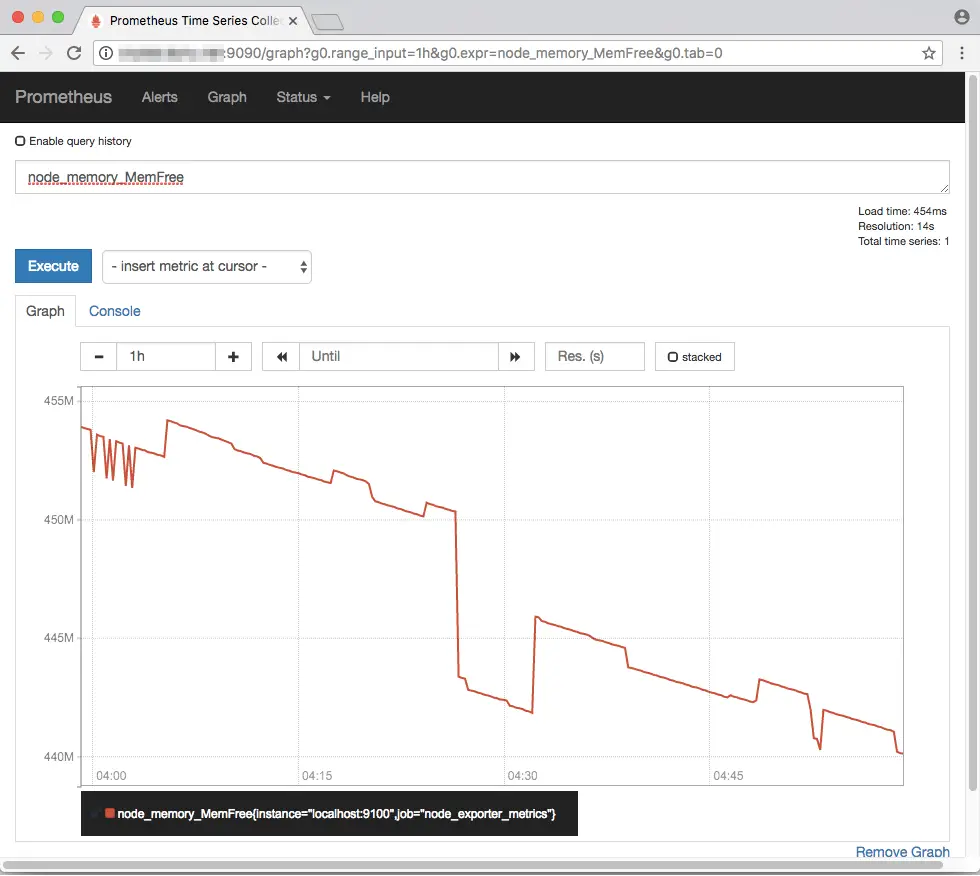
Now, suppose you want to obtain a graph of the free memory available on the system. Enter node_memory_MemFree, hit Enter and click on the Graph tab. A graph will appear like the one shown below. You can also change the time range using the controls above the graph.
So far, all our queries yield the present value of a metric. You can obtain values in the past by using the offset keyword. For example, you could view the free memory value two days ago with node_memory_MemFree offset 2d:
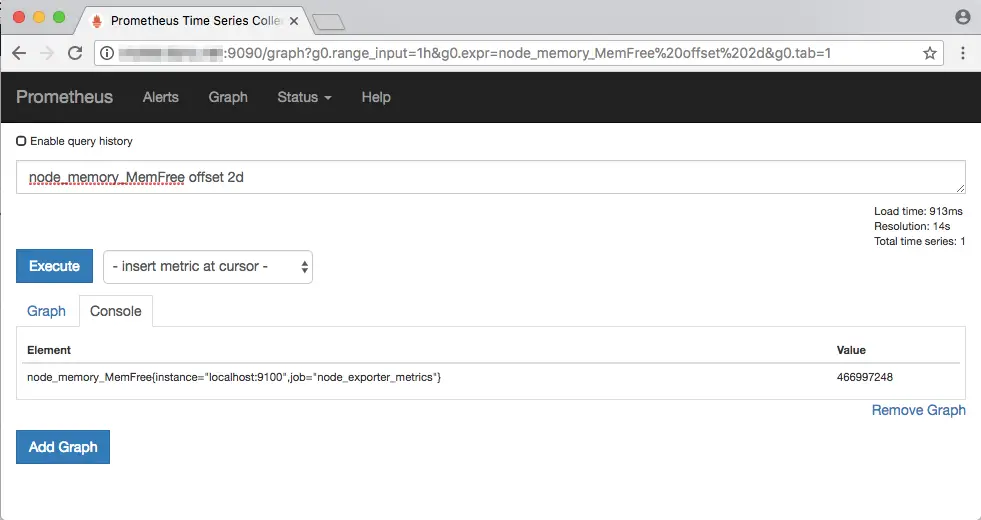
You can use the letters s, m, h, d, w and y to refer to seconds, months, hours, days, weeks and years respectively.
Until now, all our examples returned instant vectors. Now, we shall look at how to work with range vectors. To obtain a range vector, simply add a time period in square brackets after an instant vector. For instance, if you want to get the free memory values over the last one minute, run node_memory_MemFree[1m]:
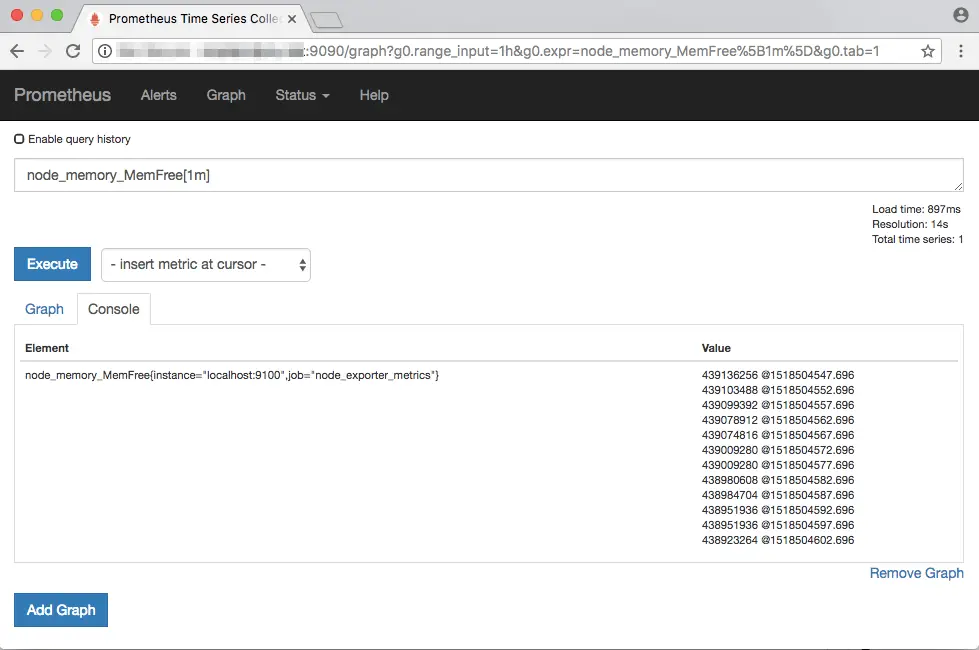
As you can see above, range vectors correspond to a set of values, along with the time at which the values were obtained. Range vectors cannot be graphed, which you can check by going to the “Graph” tab.
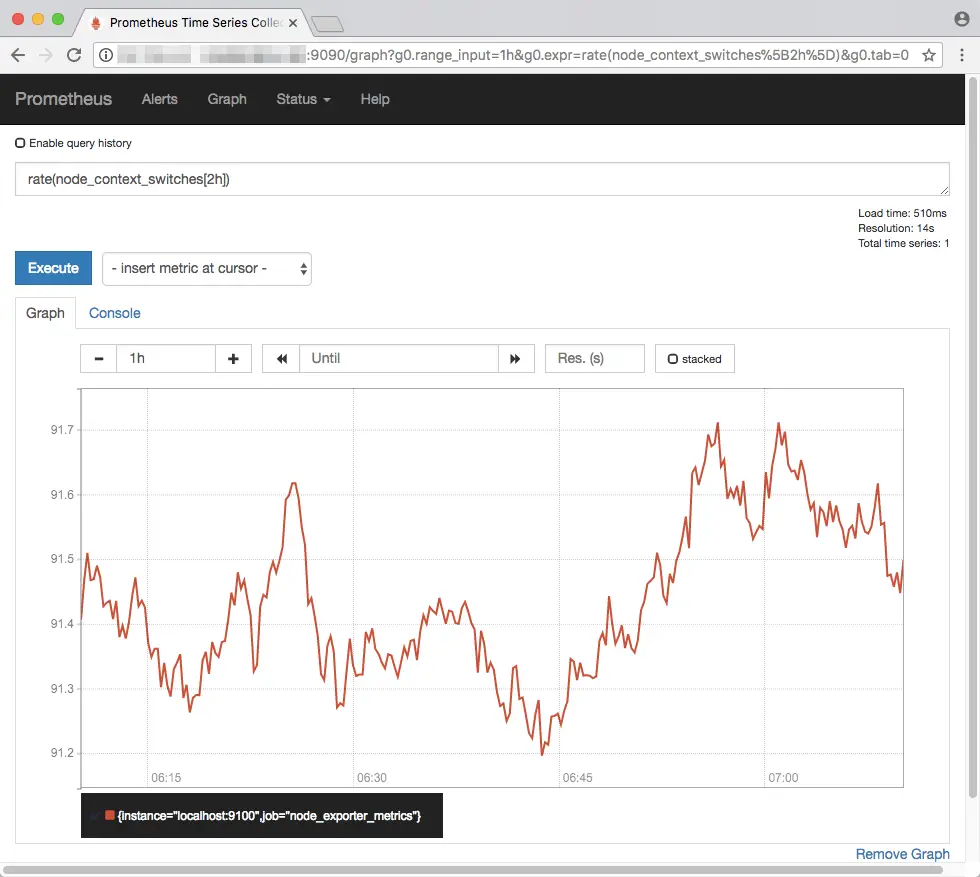
PromQL also provides many functions, which are helpful in analyzing metrics. As an illustration of PromQL’s capabilities, we will use the rate() function. Suppose, you are interested in the rate of context switches occuring on your system, for the last two hours. We obtain a range vector as discussed previously, and then obtain the rate as: rate(node_context_switches[2h]).
Conclusion
In this article, we have learnt how to install Prometheus and use it to monitor metrics of our current node. We have also seen a few examples of how to query and graph these metrics. If you want to learn more about Prometheus, the documentation is a good place to start.