How to Install and Use Glances to Monitor Linux Systems

Monitoring a system is essential for keeping things running smoothly. Glances is a Python-based tool which provides information on various aspects of the system, such as running processes, I/O, memory and so on. It can display the information on a terminal and also has a web interface which can be accessed from any device. Moreover, you can use it to monitor a remote system through its API or its various interfaces. In this article, we will see how to install and use Glances to monitor local as well as remote systems.
Installation
Installing Glances is the easiest part, thanks to their install script which makes things really simple. On most systems, you can run:
wget -O- https://bit.ly/glances | bashIf you don’t have wget installed, you can use curl instead:
curl -L https://bit.ly/glances | bashSince Glances is a Python-based tool, you can also use Python’s own package manager.
pip install glancesIf you are running as a non-root user, the script will automatically ask for your root or sudo password, depending on how your system is set up.
Using Glances
To view the details of your own system, just run the following command:
glancesIt should display information about your system, similar to the image shown below. Keep in mind that Glances may show you more information, depending on the size of the terminal and your system configuration.
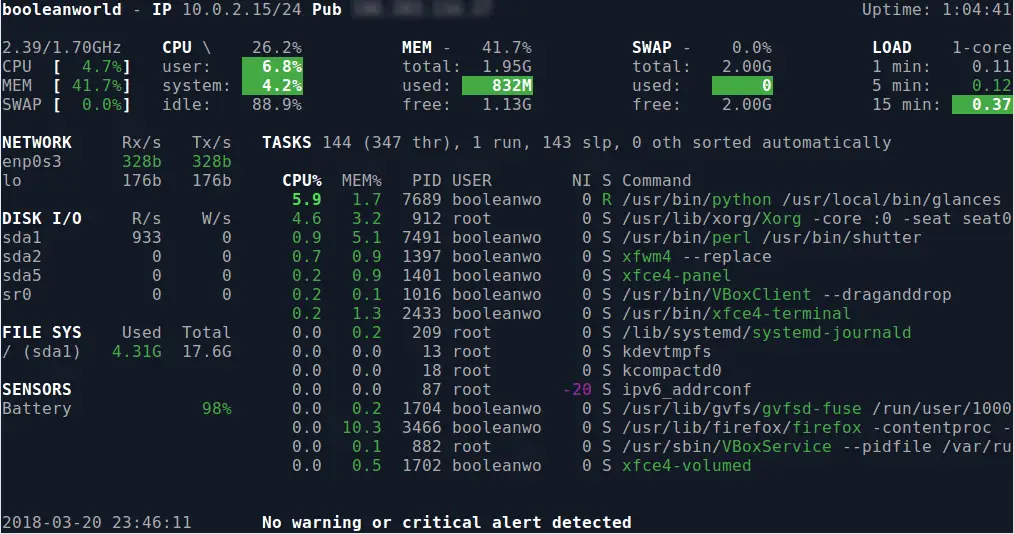
At the top left of the interface, you can see the private and public address. The top right has the uptime, which is the time for which the system has been running. This is followed by the CPU and memory statistics. The left side has the network speeds, disk speeds and usage, and any information from sensors, like battery and temperature. The right side has a list of processes, and shows details like the CPU, memory usage and process IDs.
If you are interested to know more about the statistics displayed, you can read about them in the top command article.
Glances uses colors to tell you about the status of various items. Items in green represent they’re “safe”, and those in blue tell you to be “careful” — these may cause problems in the future. Anything in violet is a “warning”, and red means the status of the item is “critical”, and you should take immediate action.
Moreover, Glances also lets you know about anything that needs your immediate attention. In the screenshot above, you can see that Glances tells us so by displaying “No warning or critical alert detected”. When there are warnings or critical items, this message changes accordingly. For example, if you have high swap usage, this changes to “High swap (paging) usage”.
To quit Glances, press the ‘q’ or ‘ESC’ key on the keyboard.
Interactive Commands
There are a number of single-letter commands that you can use to enable various functions in Glances. To see an overview of the most useful commands, type h to show the help screen. The following image shows the help screen with the list of useful commands.
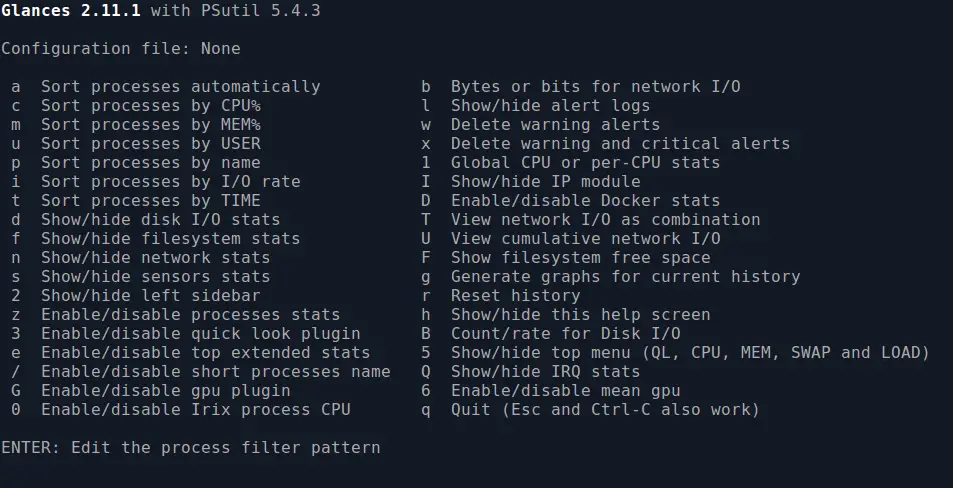
To exit the help screen press h again.
Glances has the ability to sort processes automatically on their CPU, memory or I/O usage. You can toggle this option on or off by pressing lowercase a. This option is turned on by default and will sort the processes automatically based on the resource usage. To sort processes by CPU, press lowercase c. Similarly, you can use m to sort by memory, i to sort by I/O, u to sort by user, p to sort by process name, and t to sort by time. Feel free to try out the other commands shown on the help screen.
Searching/Filtering Processes
To find a particular process, just press the Enter key. A search box will appear as shown below:
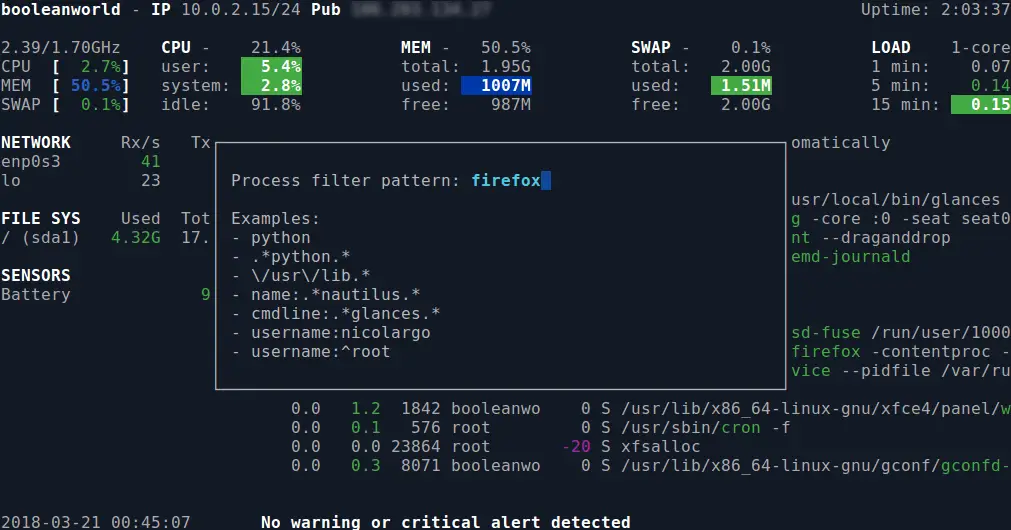
Here, you can type in a process name, or a regular expression to search for. You can also search based on other parameters, such as the username or command line arguments. For example, to search for processes belonging to the root user, you can type in username:root.
After you have typed in the search terms, press enter and it should show you a list of processes . To see more details of the filtered process, press e. It will show details of the process, as shown below:
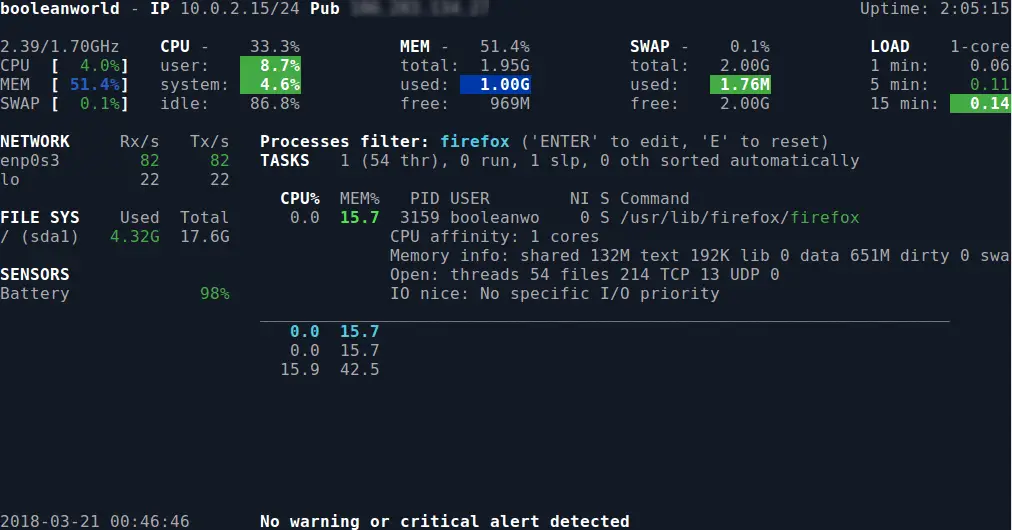
To exit the filtered process list press capital E. It should return to the default Glances page.
Client/Server Mode
If you want to monitor a system remotely, you should install Glances on the local as well as the remote system. Once you have done so, run this command on the remote system:
glances -sThis spins up a server on the remote system. Next, you can monitor the remote system from your local system by running:
glances -c <server-ip>Replace <server-ip> with the IP address or the hostname of the server.
In addition, Glances provides a “web server mode” that doesn’t require you to install it on your local system. First, launch Glances in this mode on the remote system like so:
glances -wNow, open a browser and type http://<server-ip>:61208 where <server-ip> is the public IP address/hostname of the server. You should be able to see the stats displayed in a similar format as shown in the terminal. You can even access the page with a mobile browser since the page displayed is responsive.
To change the refresh rate of the page to a faster or slower value than the default rate, just append the date at the end of the URL. For example, if you want the values to refresh after every 5 seconds, then the URL will be http://<server-ip>:61208/5.
Configuring Glances
Glances allows you to configure its behavior through a glances.conf configuration file. For Linux systems, you can save this file either in ~/.config/glances or the /etc/glances directory. If either of these directories are not present in your system, you must create them manually.
The coloring scheme of glances is explained above. Now, if you want to trigger the warnings at some custom values rather than the default values, each section must be stated explicitly in the glances.conf file. For example, if you want to specify some custom alert values for CPU usage, then you can specify the values under the [cpu] section as follows.
[cpu]
user_careful=50
user_warning=70
user_critical=90
iowait_careful=50
iowait_warning=70
iowait_critical=90
system_careful=50
system_warning=70
system_critical=90
steal_careful=50
steal_warning=70
steal_critical=90
You can change the values according to your preferences. Similarly, you can customize other sections such as memory, I/O, network in the configuration file. To see the various sections that you can use, Glances provides a sample template configuration file that you can see here.
Exporting data to Prometheus
Glances has the ability to export data to Prometheus server with the help of an exporter. Prometheus is a great monitoring tool used to pull metrics from various sources and store them in a time-series database. To install and set up Prometheus, follow our article How to Install and use Prometheus for Monitoring. Once you have set it up, create a section named [prometheus] in the glances.ini file. Add the following details in that section.
[prometheus]
host=localhost
port=9091
prefix=glances
Instead of using “localhost”, you can use your IP address or hostname of the machine where Glances is installed. Similarly, you can use any port that you want provided that it is a non-standard one. After defining the values in the configuration file, use the following command to run Glances:
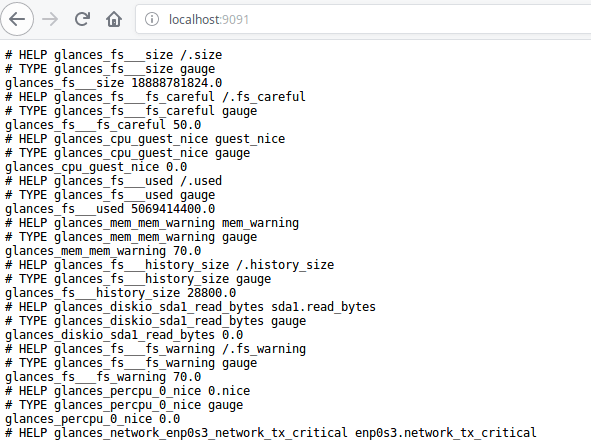
glances --export-prometheusIf you want to check if everything works, use your favorite browser and head over to http://localhost:9091 (or the IP address/hostname that you specified in the configuration file). Here, you will see that Glances makes its data available in a Prometheus-compatible format.
Now, in order to set up Prometheus monitoring, you need to add it to the prometheus.yml file.
scrape_configs:
  - job_name: 'glances_exporter'
    scrape_interval: 5s
    static_configs:
      - targets: ['localhost:9091']
You can set your own custom values in the exporter. After adding the exporter, save the file and start the Prometheus server. You will be able to see the Glances exporter in the service discovery page.
Conclusion
Glances is a great monitoring tool which has more features and a better interface than other tools like htop. However, it consumes way more resources than htop or top and can be a burden for low-powered systems. There are many more options and integrations mentioned in the official documentation that you can use to further customise Glances to your needs.