A Guide to Monitoring Servers with Nagios

Monitoring is an essential part of managing infrastructure. It helps you to ensure that your business keeps running smoothly, by alerting you to problems as they occur. Nagios is a very popular open-source application monitoring application. It features a “plugin”-based approach to monitoring, which makes it very flexible and well-suited to perform any kind of monitoring.
Nagios is available in two variants — “Nagios Core” is the free and open-source product, and “Nagios XI” provides additional functionality, but requires a software license. In this article, we will see how to install Nagios Core on a Linux server and use it to monitor the statistics of another server. Since we will solely focus on Nagios Core, we will simply call it “Nagios” in the rest of the article.
What is Nagios?
Nagios offers monitoring and alerting services for applications and infrastructure. It watches hosts and services that you specify, and alerts you when problems arise and again when things get better.
A Nagios monitoring setup consists of a number of components, as shown below.
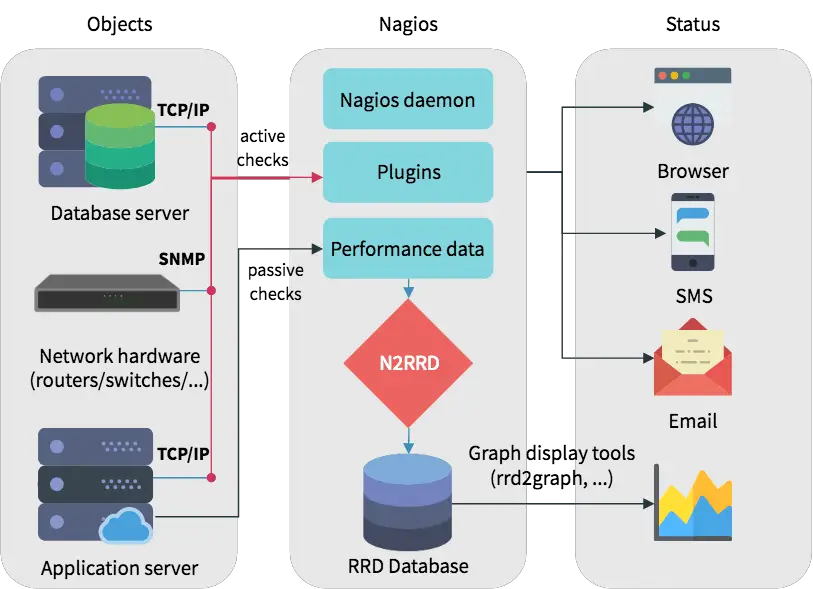
The Nagios daemon relies upon plugins for its monitoring and alerting functionality. These plugins, along with your configuration, determine which hosts and services will be checked. Usually, these are “active checks”, which means that daemon invokes the plugin at regular intervals, and gives it information about what needs to be checked. Then, the plugin performs the check, and reports the status of the hosts and services back to the daemon. A check could involve a “ping” to see if it is up, measure a host’s disk space, and so on.
On the other hand, there are “passive checks”, which are initiated by external applications. Instead of the Nagios daemon doing a check, the external application submits data to the daemon.
In addition to reporting the status, a plugin can also add some performance information. Although Nagios itself cannot understand this data, you can ask it to store this data to a file or process it by executing commands. By using a plugin like N2RRD, you can save this data in a “round robin database”, for later querying and graphing.
Nagios provides a web interface to help you see this status information. You can also configure alerts via email. Moreover, there are plugins that can deliver alerts through SMS or other media.
Setting up Nagios
In this section, we will install Nagios on a Linux installation, and then configure it to monitor host resources. We will also set up the Nagios Remote Plugin Executor (NRPE) on another host, so that we can monitor it from the Nagios server. The instructions below have been tested on Ubuntu 16.04 and CentOS 7.
To follow the rest of this guide, we assume you will execute all the following commands as root. Depending on your distribution and setup, you can run sudo -s (and type in your password) or su (and type in the root user’s password) to get access to a root shell.
Prerequisites
In order to begin with the installation procedure, we will first install a few dependencies. These include the Apache web server and PHP for the web interface, as well as tools like gcc and make for compiling programs. Since Nagios uses CGI scripts, you cannot use a server like Nginx.
On Ubuntu, run the following command:
apt update
apt install build-essential libgd2-dev openssl libssl-dev apache2 php libapache2-mod-php snmp libnet-snmp-perl gettext libmcrypt-dev libssl-dev
On CentOS, run the following command instead:
yum install -y gettext wget net-snmp-utils openssl-devel glibc-common unzip perl epel-release gcc php gd automake autoconf httpd make glibc gd-devel net-snmp
yum install perl-Net-SNMP
Then, we will create a user for Nagios to use. Run the following command in order to do so:
useradd nagiosFinally, we will add this user to Apache’s user account. Depending on the distribution you are using, type in:
usermod -a -G nagios www-data # For Ubuntu
usermod -a -G nagios apache # For CentOS
Now that we have the basic setup in place, we can install Nagios.
Installing Nagios Core
Head over to the releases page in order to grab the latest release of Nagios Core, and download it like so:
wget https://github.com/NagiosEnterprises/nagioscore/releases/download/nagios-4.3.4/nagios-4.3.4.tar.gzThen, we will extract the archive and move into the directory:
tar -xf nagios-4.3.4.tar.gz
cd nagios-4.3.4
The next step is to “configure” the project Makefiles to your system. Depending on your distribution, the commands are slightly different:
./configure --with-httpd-conf=/etc/apache2/sites-enabled # For Ubuntu
./configure # For CentOS
Then, we will compile and install the Nagios components, by running:
make all
make install
make install-init
make install-commandmode
make install-config
make install-webconf
Finally, we will configure Nagios to run automatically on boot. However, we won’t start it just yet, as we have not configured it.
systemctl enable nagiosConfiguring Apache
Now, we will configure Apache. Again, depending upon the distribution you use, the steps here vary slightly.
If you use Ubuntu, you need to enable the “rewrite” and “cgi” modules, and then restart it.
a2enmod rewrite cgiHowever, for CentOS, you simply need to start the Apache web server, and configure it to run automatically at boot:
systemctl enable httpdFinally, we will protect the Nagios web interface by adding a username and password. In this article, we will use the username “nagiosadmin”, although you can choose something else as well. You will be prompted for a password.
htpasswd -c /usr/local/nagios/etc/htpasswd.users nagiosadminThe -c flag tells htpasswd to create a new file. Thus, if you want to add another user, leave out the -c flag, like so:
htpasswd /usr/local/nagios/etc/htpasswd.users booleanworldFinally, we will restart the Apache web server by using:
systemctl restart apache2 # For Ubuntu
systemctl restart httpd # For CentOS
Installing Nagios plugins
The final step towards a basic Nagios installation is to install its plugins. First, we will navigate out of the Nagios Core directory with:
cd ..Then, head over to the releases page and grab the latest archive like so:
wget https://github.com/nagios-plugins/nagios-plugins/releases/download/release-2.2.1/nagios-plugins-2.2.1.tar.gzNext, extract the archive and move into the directory:
tar -xf nagios-plugins-2.2.1.tar.gz
cd nagios-plugins-2.2.1
Now, just like we had done previously, we will configure the “Makefiles” and install the plugins:
./configure
make install
Now that we have all the Nagios components installed, we can start the daemon. Type in the following to do so:
systemctl start nagiosNow, if you visit http://<Nagios server IP>/nagios in a browser, you will be asked for a username and password. Once you enter the details, the following page opens:
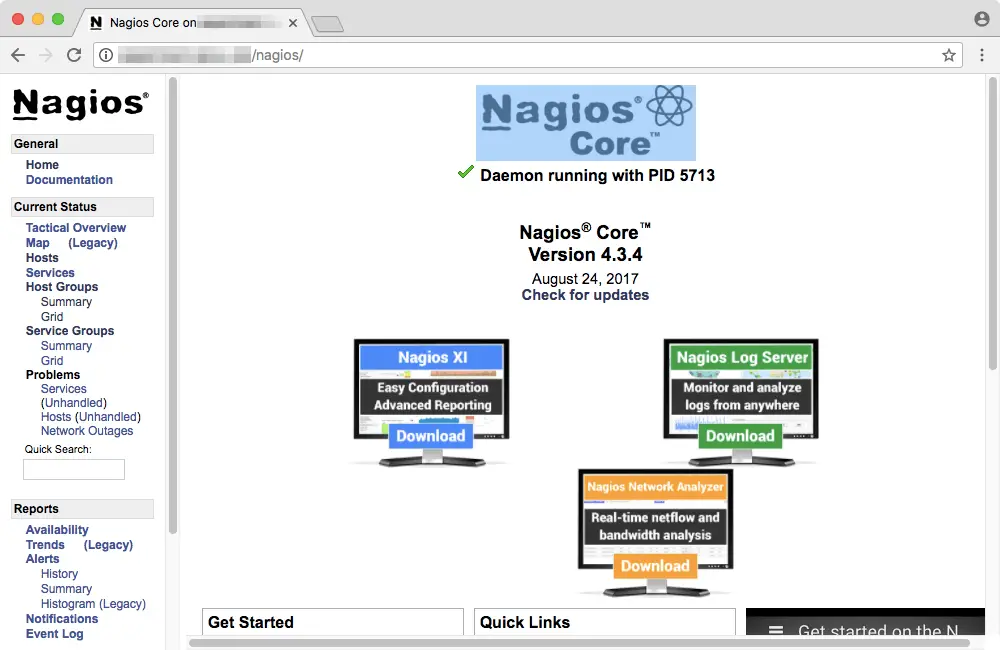
If you can see this page, congratulations! You’ve installed Nagios correctly.
Exploring the web interface
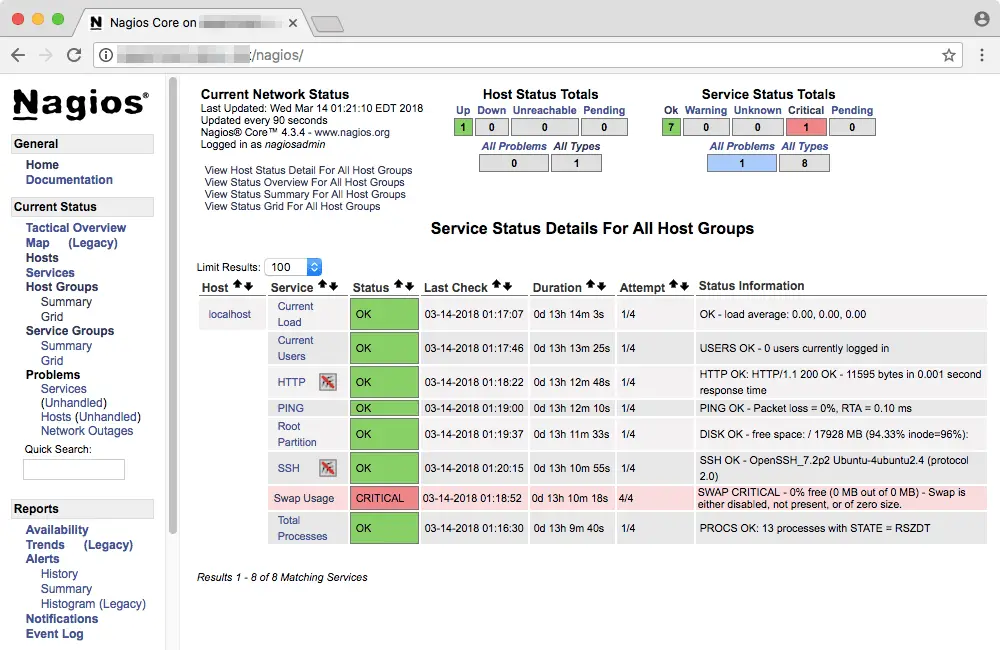
The web interface allows you to take a quick look at the status of monitored hosts and services. A “service” in this context refers to some observable aspect of a system, like its disk space or memory consumption. By default, Nagios only monitors the host it is installed on. In order to get a basic overview, you can click on “Host Groups” on the left.
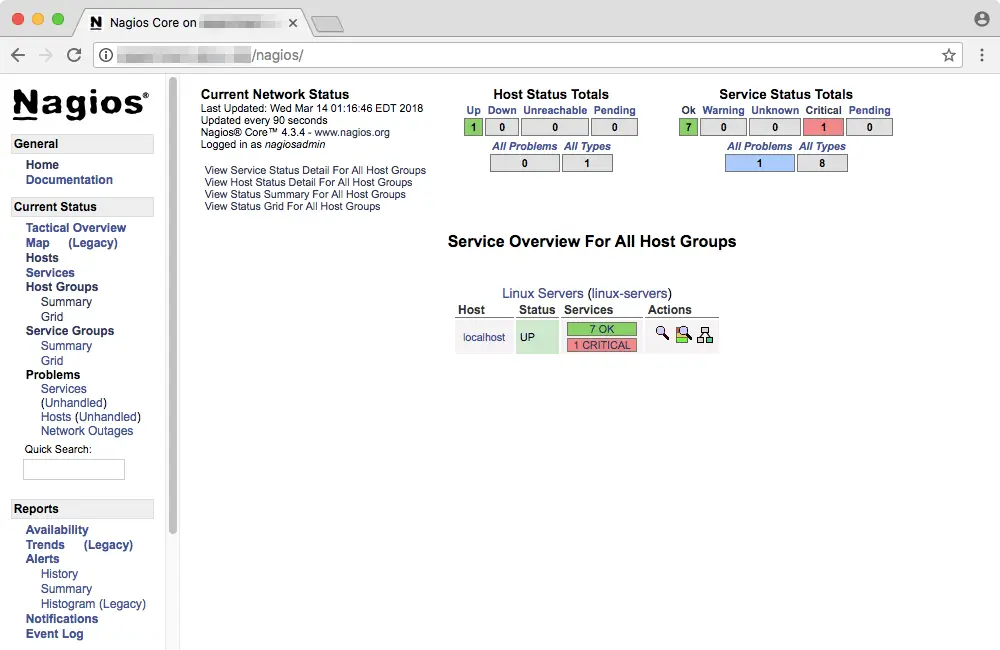
In the above example, you can see that “localhost” (which refers to the system where Nagios is installed) has a host status “UP”. Seven services are marked as “OK” and one is marked “critical”. On your system, you might find a different scenario than the one above.
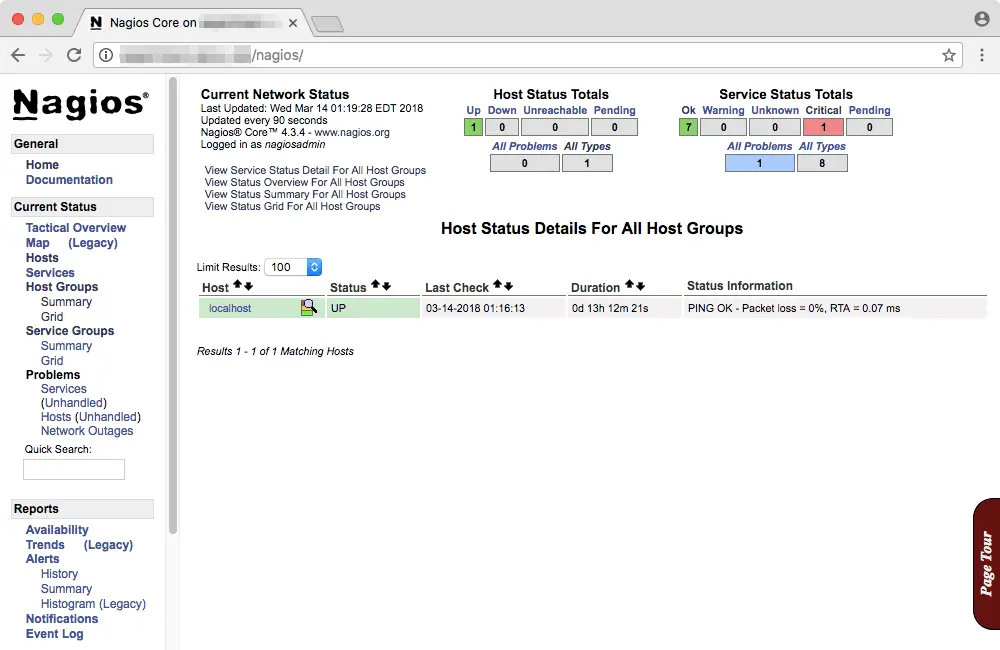
If you want to see a detailed report about the hosts, click on “View Host Status Detail For All Host Groups”.
Similarly, you can click on “View Service Status Detail For All Host Groups” to view details about the services.
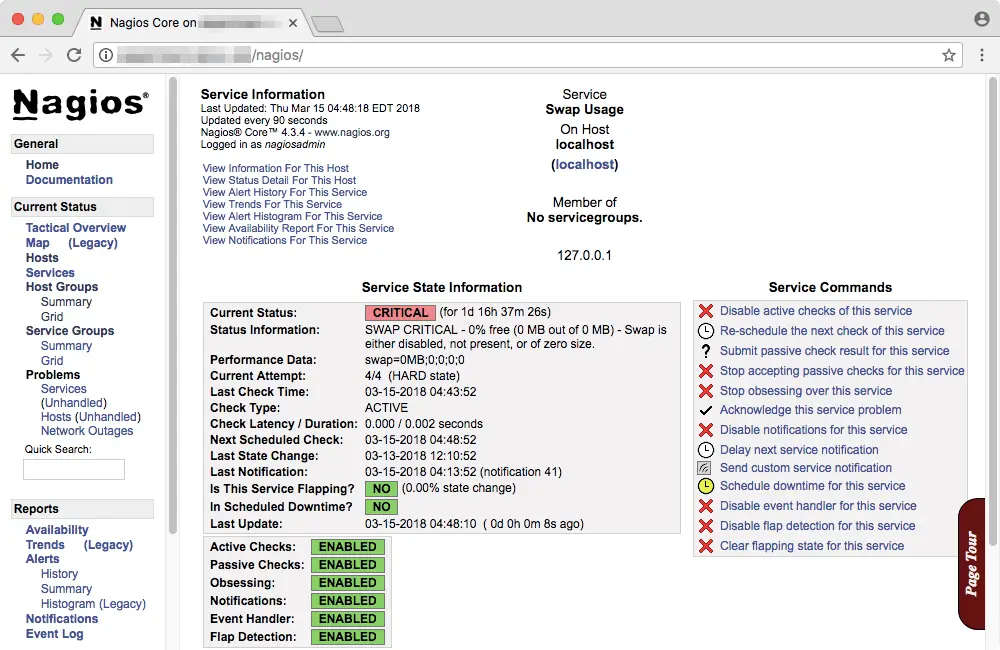
You can click on a particular entry to view more details about it. For example, here is the “Swap Usage” information page for the current node. You can also issue a number of service commands from the right, such as disabling the check.
Monitoring a remote host using NRPE
So far, we have set up Nagios to only monitor the host the host it is running on. Now, we will use NRPE to monitor the disk usage and load average of a remote host. There are several steps to this — installing the check_nrpe plugin on the Nagios server, and the NRPE daemon on the remote host. Finally, we need to edit some configuration files.
Installing the check_nrpe plugin
These steps should be run on the Nagios server. If you are inside the Nagios plugins directory, move out of it by running:
cd ..Then, go to the NRPE releases page and download the latest version like so:
wget https://github.com/NagiosEnterprises/nrpe/releases/download/nrpe-3.2.1/nrpe-3.2.1.tar.gzJust like we did previously, extract the archive and move into the directory:
tar -xf nrpe-3.2.1.tar.gz
cd nrpe-3.2.1
Next, configure the “Makefiles” as shown below.
./configureThen, run these two commands to build and install the plugin:
make check_nrpe
make install-plugin
Next, open the /usr/local/nagios/etc/objects/commands.cfg file. Here, we will define a check_nrpe command that will be used later in this article. Go to the end of the file and add the following snippet:
define command{
        command_name check_nrpe
        command_line $USER1$/check_nrpe -H $HOSTADDRESS$ -c $ARG1$
}
Installing the NRPE daemon on the remote host
Now, log in to the remote host. Once you have logged in, open a root shell with su or sudo -s, and then create a “nagios” user for NRPE to run:
useradd nagiosThen, if you are using Ubuntu, run the following commands:
apt update
apt install -y autoconf automake gcc libc6 libmcrypt-dev make libssl-dev
Otherwise, if you are running CentOS, use these commands:
yum install -y gcc glibc glibc-common openssl openssl-devel perl wgetSince NRPE needs the Nagios plugins to perform its checks, install it in the same way as we did previously. Then, download the NRPE source code, and run the steps in the “Installing the check_nrpe plugin” section, till “configuring the Makefiles”. Once you have completed, run the following commands:
make all
make install
make install-config
make install-init
Now, open the file /usr/local/nagios/etc/nrpe.cfg and find the line containing the allowed_hosts and server_address and change them like so:
allowed_hosts=127.0.0.1,::1,<Nagios server IP>
server_address=0.0.0.0
Then, we will set the NRPE daemon to run automatically on boot. We will also start the daemon to test it.
systemctl enable nrpe
systemctl start nrpe
Now, from the Nagios server, run the following command:
/usr/local/nagios/libexec/check_nrpe -H <Remote host IP>If you see a version number, this means that NRPE is up and running, and Nagios can reach it. If you see an error instead, verify that your firewall allows traffic on TCP port 5666.
Configuring NRPE
While NRPE is up and running, we haven’t set up the monitoring yet. While there is a built in command to check load averages, we have to make our own Nagios command to monitor disk usage. In order to do so, we should first find out the disks that are attached to system. Run the following command to see a list of disks and their usage levels:
df -hYou will get an output that looks like this:
Filesystem      Size  Used Avail Use% Mounted on
udev            2.0G     0  2.0G   0% /dev
tmpfs           396M   41M  356M  11% /run
/dev/sda1        49G  2.1G   47G   5% /
tmpfs           2.0G     0  2.0G   0% /dev/shm
tmpfs           5.0M     0  5.0M   0% /run/lock
tmpfs           2.0G     0  2.0G   0% /sys/fs/cgroup
tmpfs           396M     0  396M   0% /run/user/0
Here, look for the disk that is mounted on the location “/”. In the example above, it is /dev/sda1. Let us add a command to monitor the disk space. Open /usr/local/nagios/etc/nrpe.cfg and add a line like this at the end:
command[check_sda1]=/usr/lib/nagios/plugins/check_disk -w 20% -c 10% -p /dev/sda1Here, we have named our command check_sda1. You can give it any name, as long as you are consistent with your scheme. Then, we define the command. Here, we said that the check_disk plugin should give us a “warning” when the disk space is at 20% or lower. If the disk space falls to 10% or lower, it should mark the status as “critical”.
After you make these changes, restart the NRPE service with:
systemctl restart nrpeConfiguring the Nagios server
Now, we need to tell the Nagios to reach out to the remote host to collect statistics. First, let us enable the directory from which Nagios reads server configuration files. Open the /usr/local/nagios/etc/nagios.cfg file and find this line:
#cfg_dir=/usr/local/nagios/etc/serversRemove the # in front to uncomment the line. Save and exit your text editor, and then create a .cfg file under /usr/local/nagios/etc/servers. We will name ours as /usr/local/nagios/etc/servers/testserver.cfg. Regardless of the name you choose, open it in a text editor and type in the following contents:
define host {
        use                             linux-server
        host_name                       <Remote server hostname>
        alias                           <An alias for your server, can contain spaces>
        address                         <Remote server IP>
        max_check_attempts              5
        check_period                    24x7
        notification_interval           30
        notification_period             24x7
}
In this above snippet, we have used max_check_attempts to set number of times that Nagios will retry the host check command if it returns any state other than an OK state. Then, we have used check_period to control when the host should be checked. Here, we have set it to 24x7, which has its usual meaning. The notification_interval directive controls the time after which any notifications will be resent. Here, we have set it to 30 minutes. (So far, we haven’t configured notifications yet, but we will do so in the next section.) Finally, we use notification_period to tell Nagios when it should send out alerts.
Next, add in the following text to monitor the load average and disk usage:
define service {
        use                             generic-service
        host_name                       <Remote server hostname>
        service_description             CPU load
        check_command                   check_nrpe!check_load
}

define service {
        use                             generic-service
        host_name                       <Remote server hostname>
        service_description             /dev/sda1 free space
        check_command                   check_nrpe!check_sda1
}
Save the file and restart Nagios with:
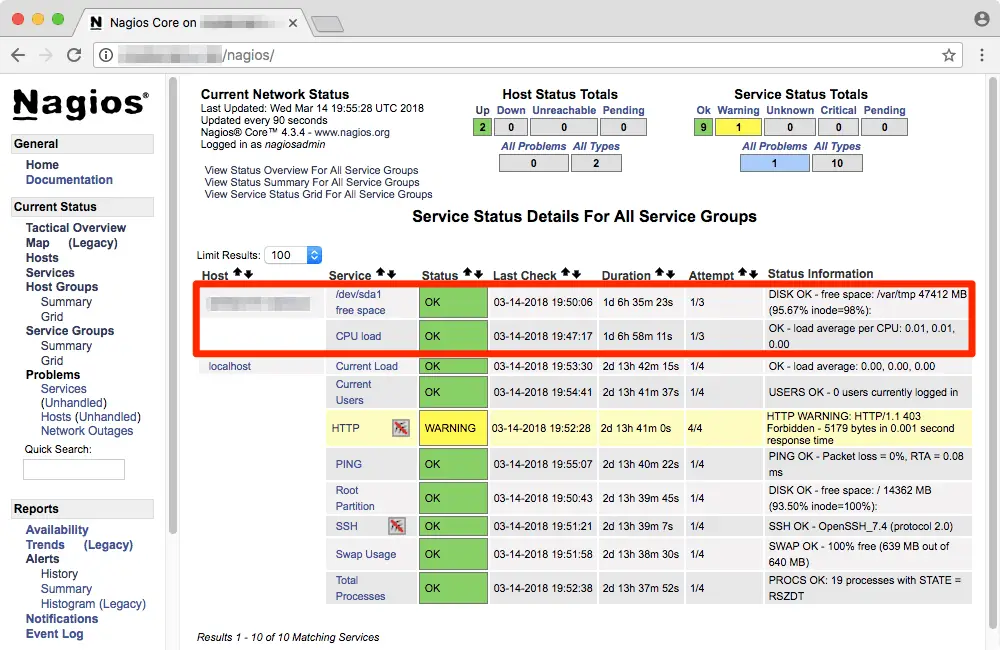
systemctl restart nagiosNow, you can find details of the host in the Host/Status details.
Configuring alerts
At this point, we have a working Nagios configuration, and we can see any problems in the web interface. However, it is more useful if we get notifications instead. By default, Nagios assumes that your system has a /bin/mail command using which it can deliver emails. However, in this article, we will deliver our emails through SMTP, with a service like GMail or Yahoo.
First, if you want to use a service like GMail or Yahoo, ensure that access for “less secure apps” is enabled. This is required so that non-interactive applications can send out mail.
Then, open the /usr/local/nagios/etc/objects/contacts.cfg file. Inside this file, there will be a contact block with an email directive. Find the line and add the email address where you want alerts to be delivered.
define contact{
        ......
        email                           <The email address where alerts will be delivered>
}
Save this file and exit the editor. The next step is to download a command-line SMTP client — we will use this in our article.
If you use Ubuntu, you have to install a few dependencies first.
apt install php php-cli php-gd php-curl php-zip php-intl php-mbstring php-xmlHowever, if you are on CentOS, you should run these commands to upgrade your PHP version, and then the necessary dependencies:
yum install yum-utils http://rpms.remirepo.net/enterprise/remi-release-7.rpm
yum-config-manager --enable remi-php70
yum install php php-cli php-gd php-curl php-zip php-intl php-mbstring php-xml
Next, we will download and install “Composer”, which is a PHP package manager:
wget -O - https://getcomposer.org/installer | phpNow, download the SMTP client, and extract it:
wget https://github.com/boolean-world/smtp-cli/archive/master.zip
unzip -d /opt master.zip
Then, we will install a few things that the SMTP client needs. Run the following commands:
cd /opt/smtp-cli-master
composer install
In this directory, create a config.json file, with the sender’s details. This includes the sending SMTP server and the sender’s email address. For example, if you want to send emails from GMail, the configuration file would look like this:
{
 "host": "smtp.gmail.com",
 "username": "[email protected]",
 "password": "the-password-of-the-account",
 "secure": "tls",
 "port": 587
}
Now, open the /usr/local/nagios/etc/objects/commands.cfg file. Here, find the block with the command_name value set to notify-host-by-email. This block contains commands that are used to send out mails when there is a problem with a host. Below the command_name line, there is a command line that looks like this:
command /usr/bin/printf "%b" ... | /bin/mail -s ...Replace the part containing /bin/mail -s with /opt/smtp-cli-master/smtp-cli.php. Repeat this process for the block containing the notify-service-by-email.
Now we can test the setup by triggering a critical condition. For example, if the monitored host has 30 GB disk space available, you can fill it up to 28 GB by running the following command:
dd if=/dev/zero of=zero.bin bs=1M count=$((28*1024))You should wait for a few minutes till Nagios performs the check and sends out an alert. Later, when you get a mail, you can simply remove the zero.bin file.
Conclusion
In this article, we installed Nagios and configured it to monitor another host. We have also seen a few examples of how to write your own commands and how to configure alerting. If you are interested to learn more, be sure check out the Nagios documentation. If you want to have a nicer web interface, have a look at Ninja.