A Guide to the Linux “Top” Command

The top command allows users to monitor processes and system resource usage on Linux. It is one of the most useful tools in a sysadmin’s toolbox, and it comes pre-installed on every distribution. Unlike other commands such as ps, it is interactive, and you can browse through the list of processes, kill a process, and so on.
In this article, we are going to understand how to use the top command.
[toc]
Getting started
As you might have already guessed, you simply need to type this in to launch top:
top
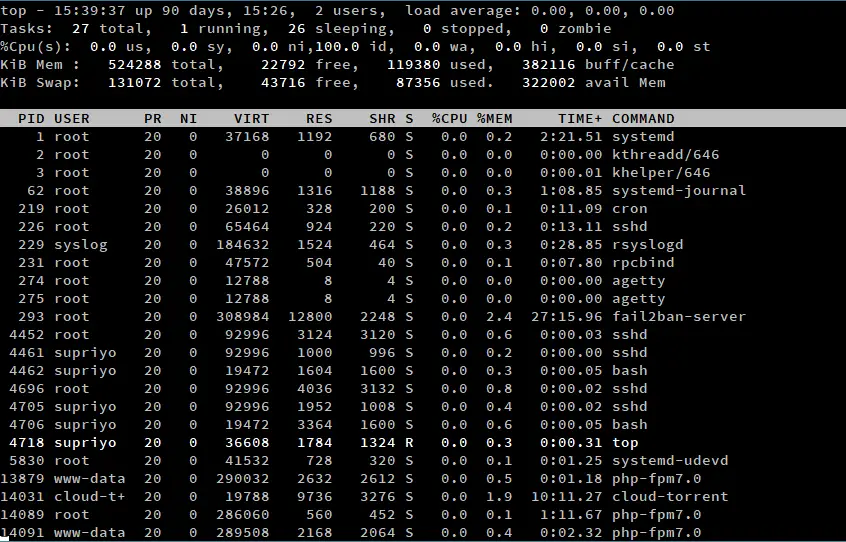
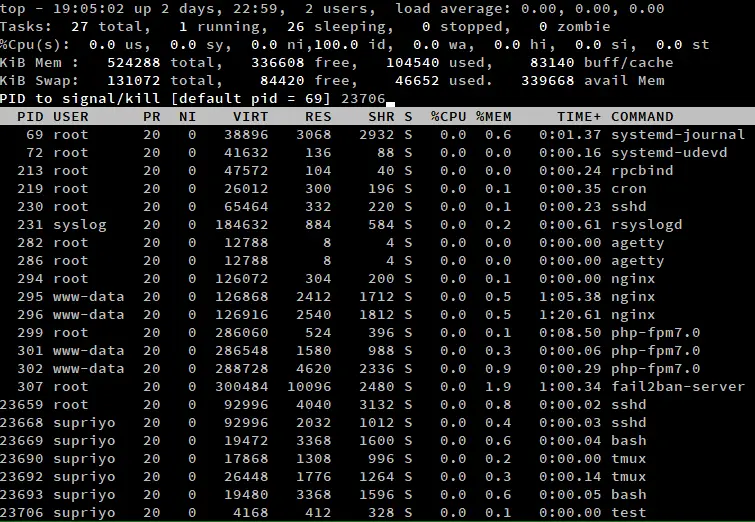
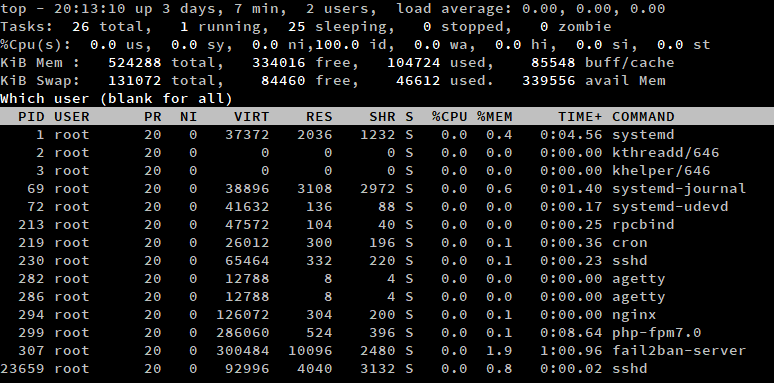
This starts up an interactive command line application, similar to one in the screenshot below. The upper half of the output contains statistics on processes and resource usage, while the lower half contains a list of the currently running processes. You can use the arrow keys and Page Up/Down keys to browse through the list. If you want to quit, simply press “q”.
There are a number of variants of top, but in the rest of this article, we will talk about the most common variant — the one that comes with the “procps-ng” package. You can verify this by running:
top -v
If you have this variant, this will show up in the output, like so:
procps-ng version 3.3.10
There is quite a bit going on in top’s interface, so we will break it down bit by bit in the next section.
Understanding top’s interface: the summary area
As we have previously seen, top’s output is divided into two different sections. In this part of the article, we’re going to focus on the elements in half of the output. This region is also called the “summary area”.
System time, uptime and user sessions
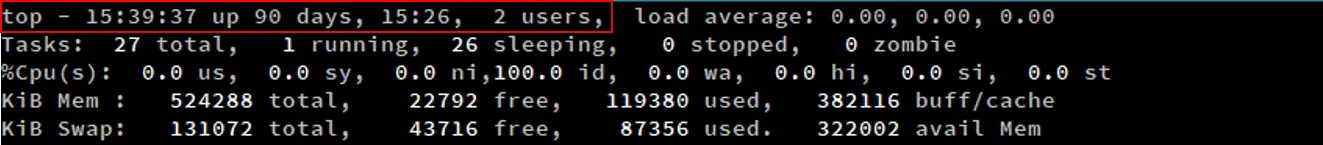
At the very top left of the screen (as marked in the screenshot above), top displays the current time. This is followed by the system uptime, which tells us the time for which the system has been running. For instance, in our example, the current time is “15:39:37”, and the system has been running for 90 days, 15 hours and 26 minutes.
Next comes the number of active user sessions. In this example, there are two active user sessions. These sessions may be either made on a TTY (physically on the system, either through the command line or a desktop environment) or a PTY (such as a terminal emulator window or over SSH). In fact, if you log in to a Linux system through a desktop environment, and then start a terminal emulator, you will find there will be two active sessions.
If you want to get more details about the active user sessions, use the who command.
Memory usage
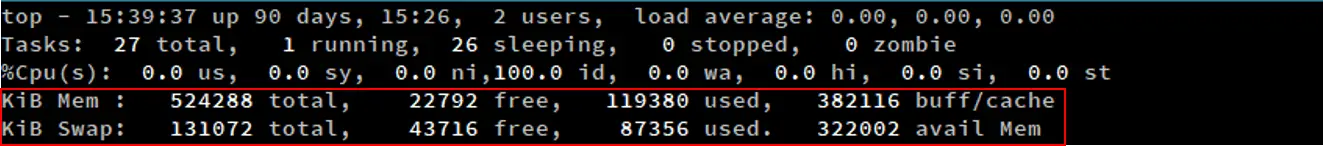
The “memory” section shows information regarding the memory usage of the system. The lines marked “Mem” and “Swap” show information about RAM and swap space respectively. Simply put, a swap space is a part of the hard disk that is used like RAM. When the RAM usage gets nearly full, infrequently used regions of the RAM are written into the swap space, ready to be retrieved later when needed. However, because accessing disks are slow, relying too much on swapping can harm system performance.
As you would naturally expect, the “total”, “free” and “used” values have their usual meanings. The “avail mem” value is the amount of memory that can be allocated to processes without causing more swapping.
The Linux kernel also tries to reduce disk access times in various ways. It maintains a “disk cache” in RAM, where frequently used regions of the disk are stored. In addition, disk writes are stored to a “disk buffer”, and the kernel eventually writes them out to the disk. The total memory consumed by them is the “buff/cache” value. It might sound like a bad thing, but it really isn’t — memory used by the cache will be allocated to processes if needed.
Tasks
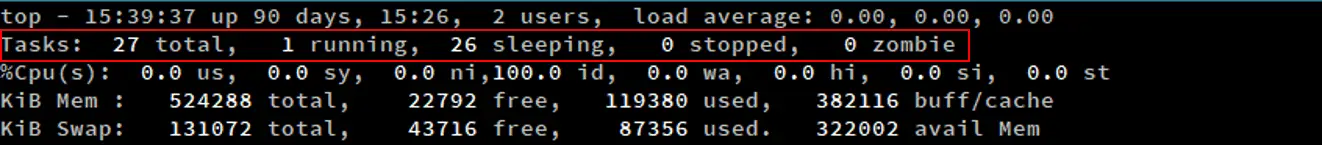
The “Tasks” section shows statistics regarding the processes running on your system. The “total” value is simply the total number of processes. For example, in the above screenshot, there are 27 processes running. To understand the rest of the values, we need a little bit of background on how the Linux kernel handles processes.
Processes perform a mix of I/O-bound work (such as reading disks) and CPU-bound work (such as performing arithmetic operations). The CPU is idle when a process performs I/O, so OSes switch to executing other processes during this time. In addition, the OS allows a given process to execute for a very small amount of time, and then it switches over to another process. This is how OSes appear as if they were “multitasking”. Doing all this requires us to keep track of the “state” of a process. In Linux, a process may be in of these states:
- Runnable (R): A process in this state is either executing on the CPU, or it is present on the run queue, ready to be executed.
- Interruptible sleep (S): Processes in this state are waiting for an event to complete.
- Uninterruptible sleep (D): In this case, a process is waiting for an I/O operation to complete.
- Stopped (T): These processes have been stopped by a job control signal (such as by pressing Ctrl+Z) or because they are being traced.
- Zombie (Z): The kernel maintains various data structures in memory to keep track of processes. A process may create a number of child processes, and they may exit while the parent is still around. However, these data structures must be kept around until the parent obtains the status of the child processes. Such terminated processes whose data structures are still around are called zombies.
Processes in the D and S states are shown in “sleeping”, and those in the T state are shown in “stopped”. The number of zombies are shown as the “zombie” value.
CPU usage
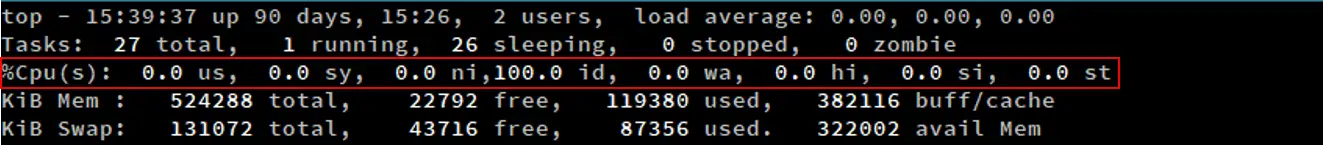
The CPU usage section shows the percentage of CPU time spent on various tasks. The us value is the time the CPU spends executing processes in userspace. Similarly, the sy value is the time spent on running kernelspace processes.
Linux uses a “nice” value to determine the priority of a process. A process with a high “nice” value is “nicer” to other processes, and gets a low priority. Similarly, processes with a lower “nice” gets higher priority. As we shall see later, the default “nice” value can be changed. The time spent on executing processes with a manually set “nice” appear as the ni value.
This is followed by id, which is the time the CPU remains idle. Most operating systems put the CPU on a power saving mode when it is idle. Next comes the wa value, which is the time the CPU spends waiting for I/O to complete.
Interrupts are signals to the processor about an event that requires immediate attention. Hardware interrupts are typically used by peripherals to tell the system about events, such as a keypress on a keyboard. On the other hand, software interrupts are generated due to specific instructions executed on the processor. In either case, the OS handles them, and the time spent on handling hardware and software interrupts are given by hi and si respectively.
In a virtualized environment, a part of the CPU resources are given to each virtual machine (VM). The OS detects when it has work to do, but it cannot perform them because the CPU is busy on some other VM. The amount of time lost in this way is the “steal” time, shown as st.
Load average
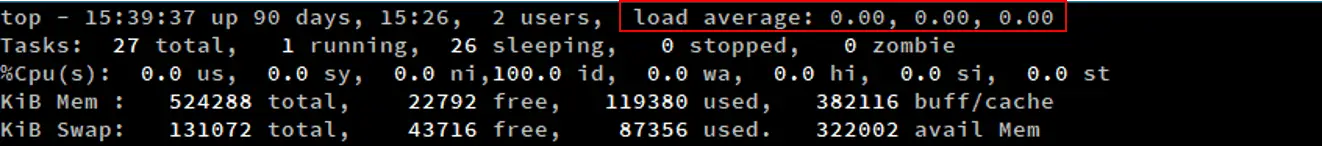
The load average section represents the average “load” over one, five and fifteen minutes. “Load” is a measure of the amount of computational work a system performs. On Linux, the load is the number of processes in the R and D states at any given moment. The “load average” value gives you a relative measure of how long you must wait for things to get done.
Let us consider a few examples to understand this concept. On a single core system, a load average of 0.4 means the system is doing only 40% of work it can do. A load average of 1 means that the system is exactly at capacity — the system will be overloaded by adding even a little bit of additional work. A system with a load average of 2.12 means that it is overloaded by 112% more work than it can handle.
On a multi-core system, you should first divide the load average with the number of CPU cores to get a similar measure.
In addition, “load average” isn’t actually the typical “average” most of us know. It is an “exponential moving average“, which means a small part of the previous load averages are factored into the current value. If you’re interested, this article covers all the technical details.
Understanding top’s interface: the task area
The summary area is comparatively simpler, and it contains a list of processes. In this section, we will learn about the different columns shown in top’s default output.
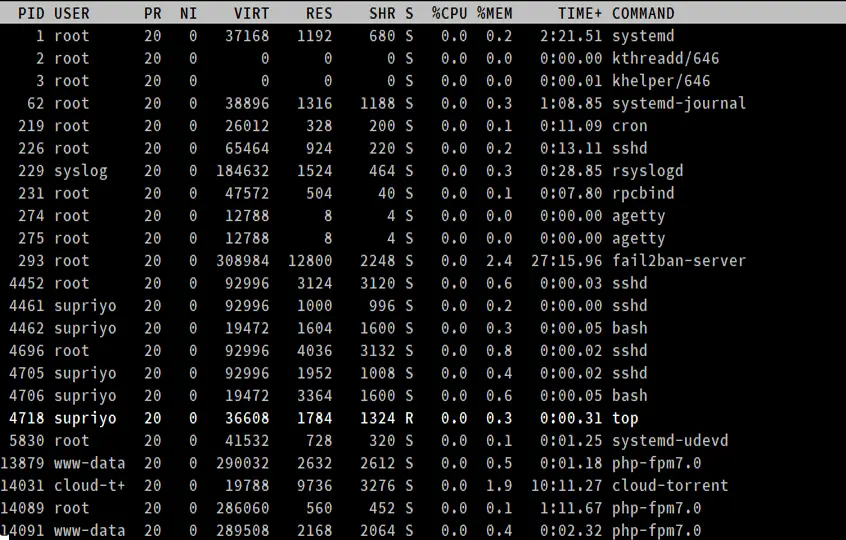
- PID
This is the process ID, a unique positive integer that identifies a process.
- USER
This is the “effective” username (which maps to a user ID) of the user who started the process. Linux assigns a real user ID and an effective user ID to processes; the latter allows a process to act on behalf of another user. (For example, a non-root user can elevate to root in order to install a package.)
- PR and NI
The “NI” field shows the “nice” value of a process. The “PR” field shows the scheduling priority of the process from the perspective of the kernel. The nice value affects the priority of a process.
- VIRT, RES, SHR and %MEM
These three fields are related with to memory consumption of the processes. “VIRT” is the total amount of memory consumed by a process. This includes the program’s code, the data stored by the process in memory, as well as any regions of memory that have been swapped to the disk. “RES” is the memory consumed by the process in RAM, and “%MEM” expresses this value as a percentage of the total RAM available. Finally, “SHR” is the amount of memory shared with other processes.
- S
As we have seen before, a process may be in various states. This field shows the process state in the single-letter form.
- TIME+
This is the total CPU time used by the process since it started, precise to the hundredths of a second.
- COMMAND
The COMMAND column shows the name of the processes.
Top command usage examples
So far, we have discussed about top’s interface. However, it can also manage processes, and you can control various aspects of top’s output. In this section, we’re going to take at a few examples.
In most of the examples below, you have to press a key while top is running. Keep in mind that these keypresses are case sensitive — so if you press “k” while Caps Lock is on, you have actually pressed a “K”, and the command won’t work, or do something else entirely.
Killing processes
If you want to kill a process, simply press ‘k’ when top is running. This will bring up a prompt, which will ask for the process ID of the process and press enter.
Next, enter the signal using which the process should be killed. If you leave this blank, top uses a SIGTERM, which allows processes to terminate gracefully. If you want to kill a process forcefully, you can type in SIGKILL here. You can also type in the signal number here. For example, the number for SIGTERM is 15 and SIGKILL is 9.
If you leave the process ID blank and hit enter directly, it will terminate the topmost process in the list. As we’ve mentioned previously, you can scroll using the arrow keys, and change the process you want to kill in this way.
Sorting the process list
One of the most frequent reasons to use a tool like top is to find out which process is consuming the most resources. You can press the following keys to sort the list:
- ‘M’ to sort by memory usage
- ‘P’ to sort by CPU usage
- ‘N’ to sort by process ID
- ‘T’ to sort by the running time
By default, top displays all results in descending order. However, you can switch to ascending order by pressing ‘R’.
You can also sort the list with the -o switch. For example, if you want to sort processes by CPU usage, you can do so with:
top -o %CPU
You can sort the list by any of the attributes in the summary area in the same way.
Showing a list of threads instead of processes
We have previously touched upon how Linux switches between processes. Unfortunately, processes do not share memory or other resources, making such switches rather slow. Linux, like many other operating systems, supports a “lightweight” alternative, called a “thread”. They are part of a process and share certain regions of memory and other resources, but they can be run concurrently like processes.
By default, top shows a list of processes in its output. If you want to list the threads instead, press ‘H’ when top is running. Notice that the “Tasks” line says “Threads” instead, and shows the number of threads instead of processes.
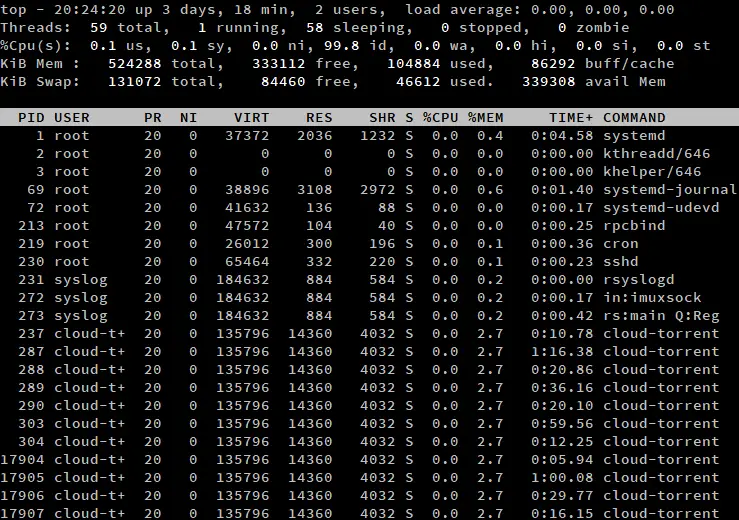
You may have noticed how none of the attributes in the process list changed. How is that possible, given that processes differ from threads? Inside the Linux kernel, threads and processes are handled using the same data structures. Thus, every thread has its own ID, state and so on.
If you want to switch back to the process view, press ‘H’ again. In addition, you can use the -H switch to display threads by default.
top -H
Showing full paths
By default, top does not show the full path to the program, or make a distinction between kernelspace processes and userspace processes. If you need this information, press ‘c’ while top is running. Press ‘c’ again to go back to the default.
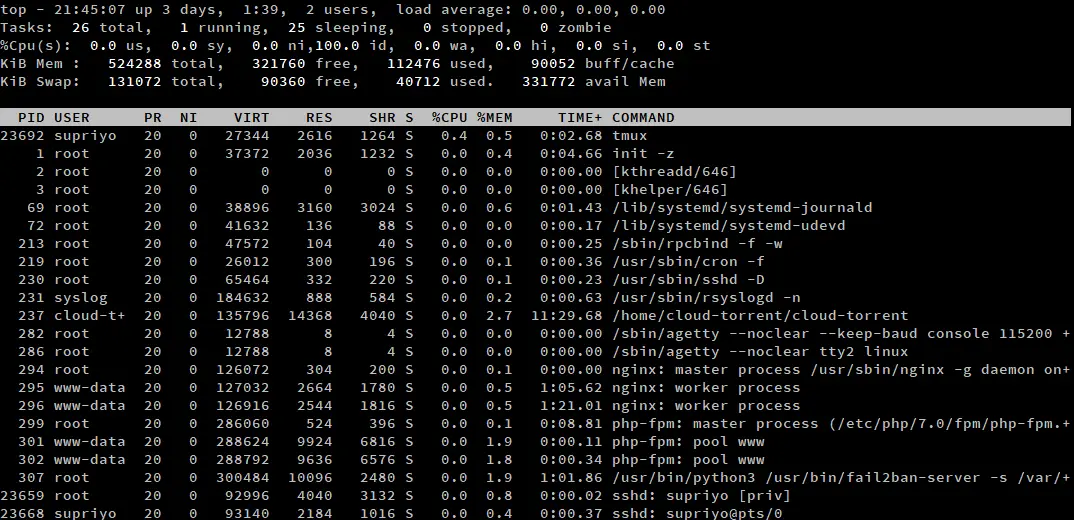
Kernelspace processes are marked with square brackets around them. As an example, in the above screenshot there are two kernel processes, kthreadd and khelper. On most Linux installations, there will usually be a few more of them.
Alternatively, you can also start top with the -c argument:
top -c
Forest view
Sometimes, you may want to see the child-parent hierarchy of processes. You can see this with the forest view, by pressing ‘v’/’V’ while top is running.
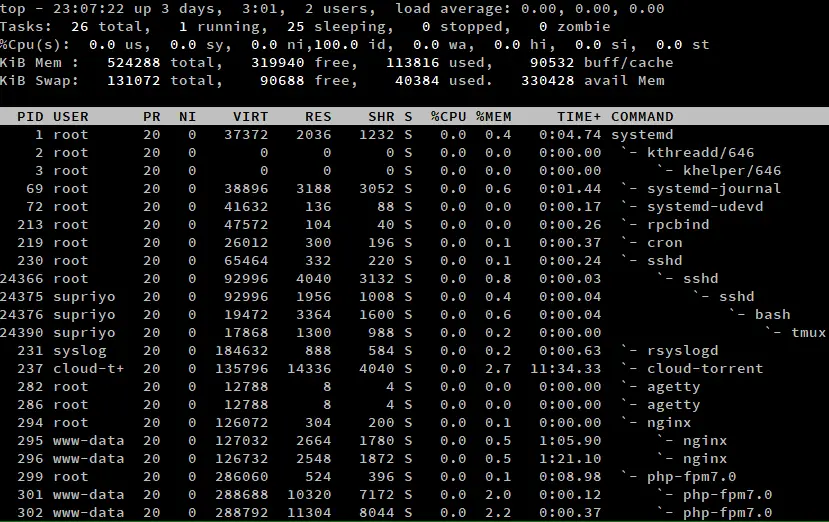
As you can tell from the screenshot above, the systemd process was the first one to start up on the system. It has started processes such as sshd, which in turn has created other sshd processes, and so on.
Listing processes from a user
To list processes from a certain user, press ‘u’ when top is running. Then, type in the username, or leave it blank to display processes for all users.
Alternatively, you can run the top command with the -u switch. In this example, we have listed all processes from the root user.
top -u root
Filtering through processes
If you have a lot of processes to work with, a simple sort won’t work well enough. In such a situation, you can use top’s filtering to focus on a few processes. To activate this mode, press ‘o’/’O’. A prompt appears inside top, and you can type a filter expression here.
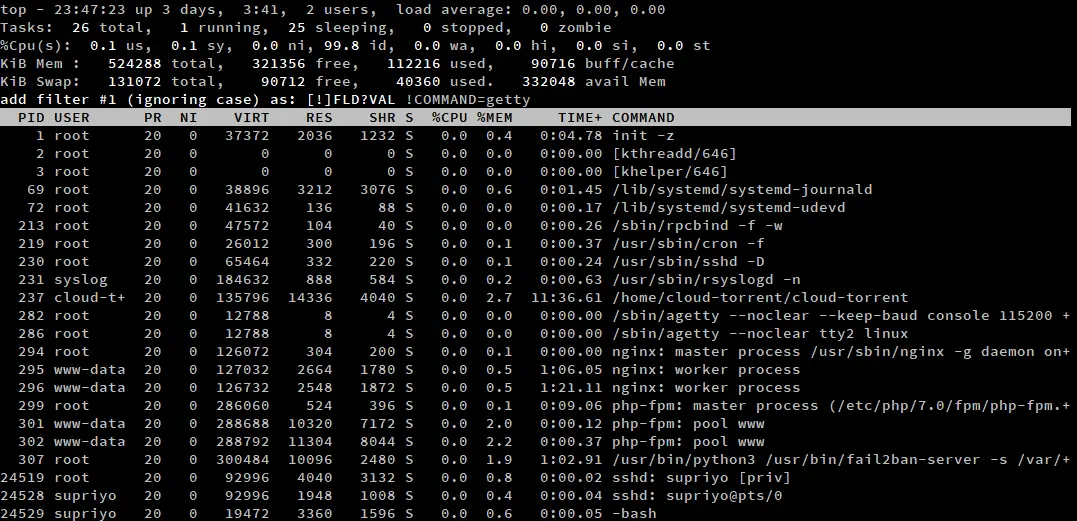
A filter expression is a statement that specifies a relation between an attribute and a value. Some examples of filters are:
COMMAND=getty: Filter processes which contain “getty” in the COMMAND attribute.!COMMAND=getty: Filter processes which do not have “getty” in the COMMAND attribute.%CPU>3.0: Filter processes which have a CPU utilization of more than 3%.
Once you’ve added a filter, you can further prune down things by adding more filters. To clear any filters you have added, press ‘=’.
Changing the default look of the CPU and memory statistics
If you are mostly at home in a GUI environment, you might not like top’s default way of showing CPU and memory statistics. You can press ‘t’ and ‘m’ to change the style of the CPU and memory statistics. Here is a screenshot of top, where we have pressed ‘t’ and ‘m’ once.
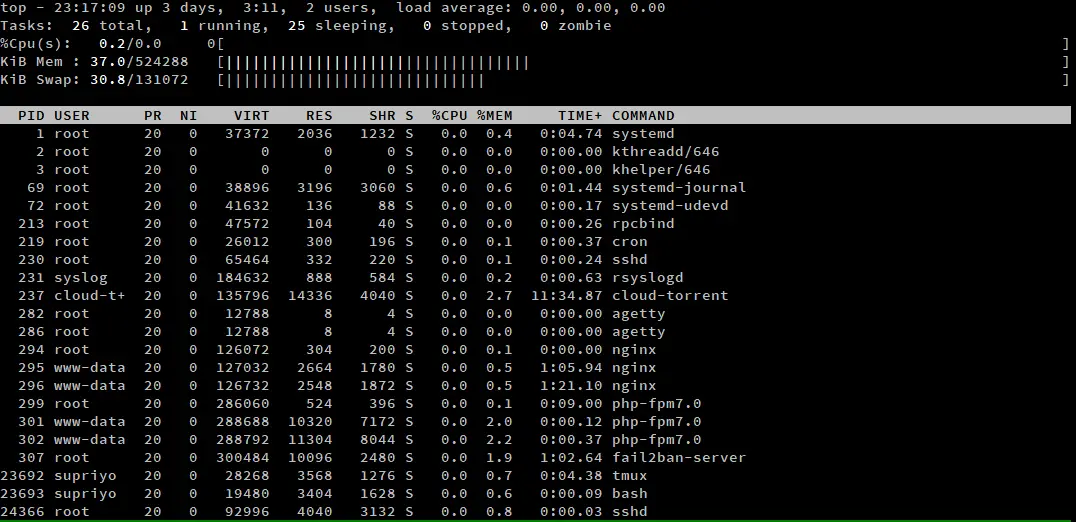
If you press ‘t’ or ‘m’ repeatedly, it cycles through four different views. In the first two presses, it cycles through two different types of progress bars. If you press the key for a third time, the progress bar is hidden. If you press the key again, it brings back the default, text based counters.
Saving your settings
If you’ve made any changes to top’s output, you can save them for later use by pressing ‘W’. top writes its configuration to the .toprc file in your home directory.
Conclusion
The top command is extremely helpful for monitoring and managing processes on a Linux system. This article only scratches the surface, and there is quite a bit we haven’t covered. For example, there are a lot more columns you can add to top. For all this stuff, be sure to check out the man page by running man top on your system.